Web UI
WatchWarden's web dashboard gives you real-time visibility and control over Docker containers across all your hosts. Data is fetched via REST API and refreshed automatically, while a WebSocket connection pushes live events (update progress, agent status changes, check results) for instant UI updates without manual refresh.
All screenshots below have an interactive slider — drag to compare dark and light themes.
Dashboard
The main dashboard shows a summary of your infrastructure at a glance: online agents, containers with available updates, and recent update activity.
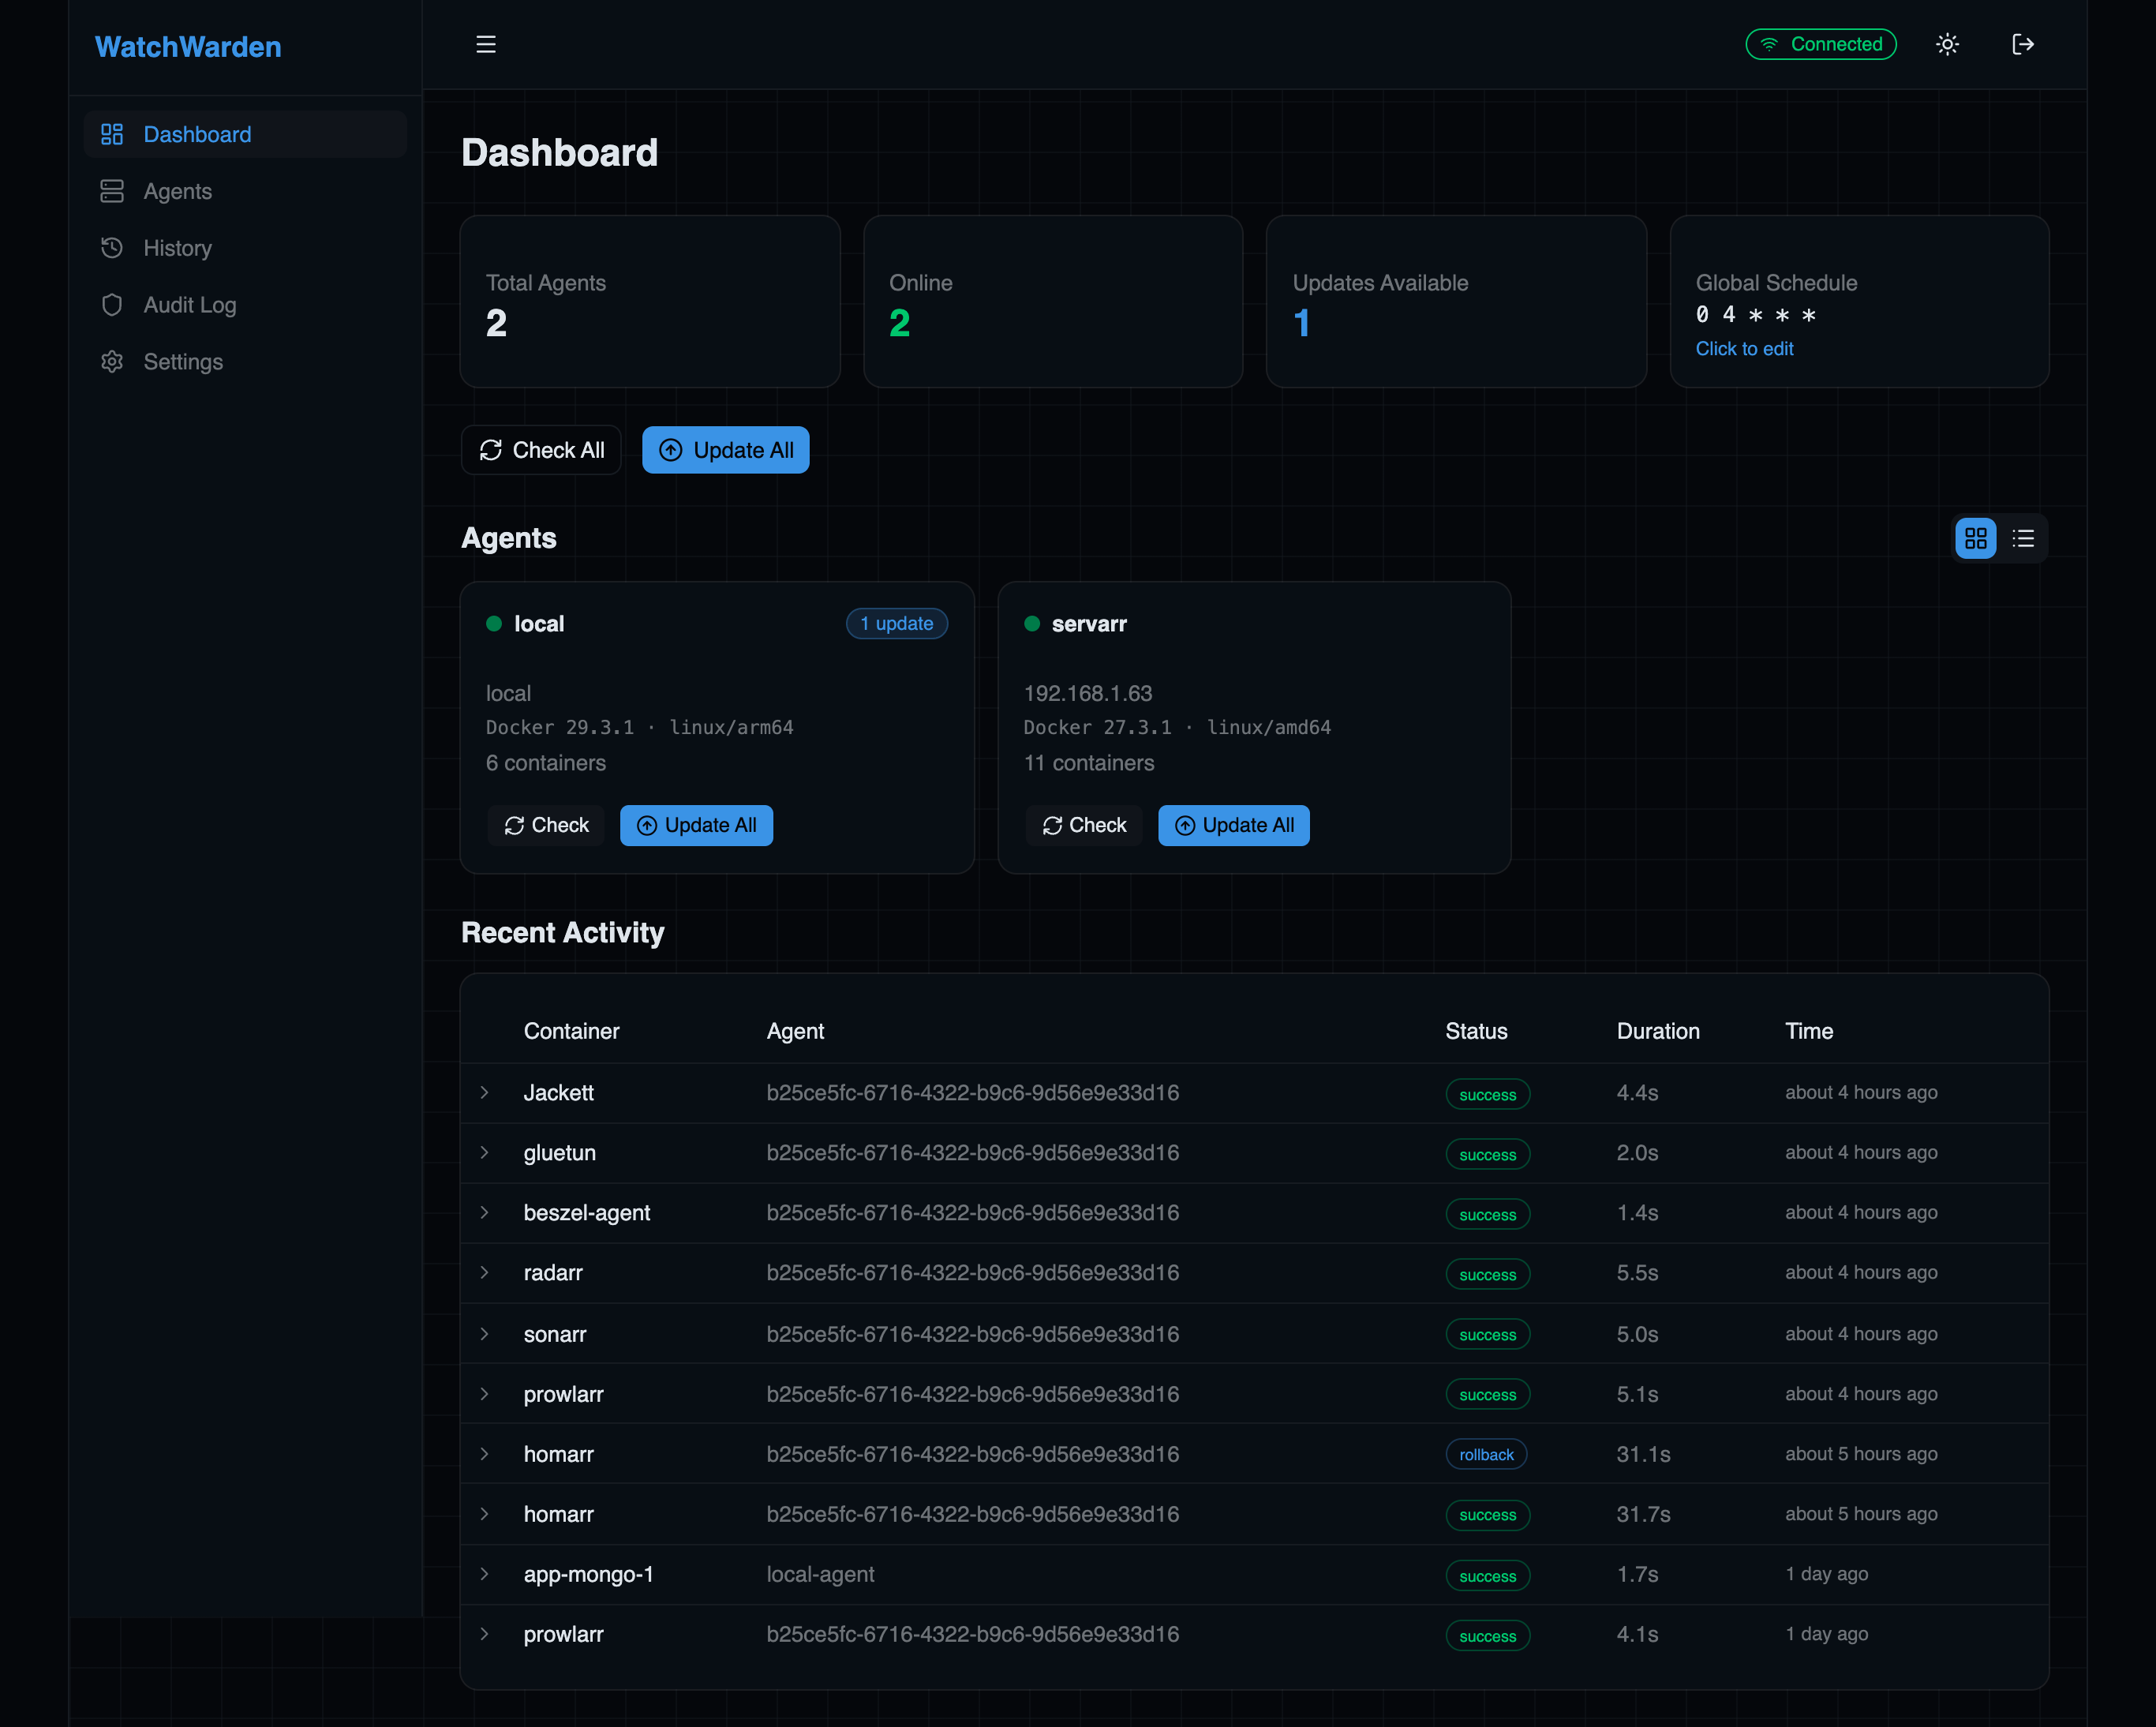
Key elements:
- Summary cards — total agents, containers, updates available, and unhealthy count
- Agent list — all registered agents with status, hostname, schedule, and last seen time
- Check All / Update All — bulk actions across all online agents
- Recent Activity — expandable update history with status, duration, and digest details
Agents
The Agents page shows all registered Docker hosts. Each agent card displays the Docker version, platform (linux/amd64, linux/arm64), container count, and update availability.
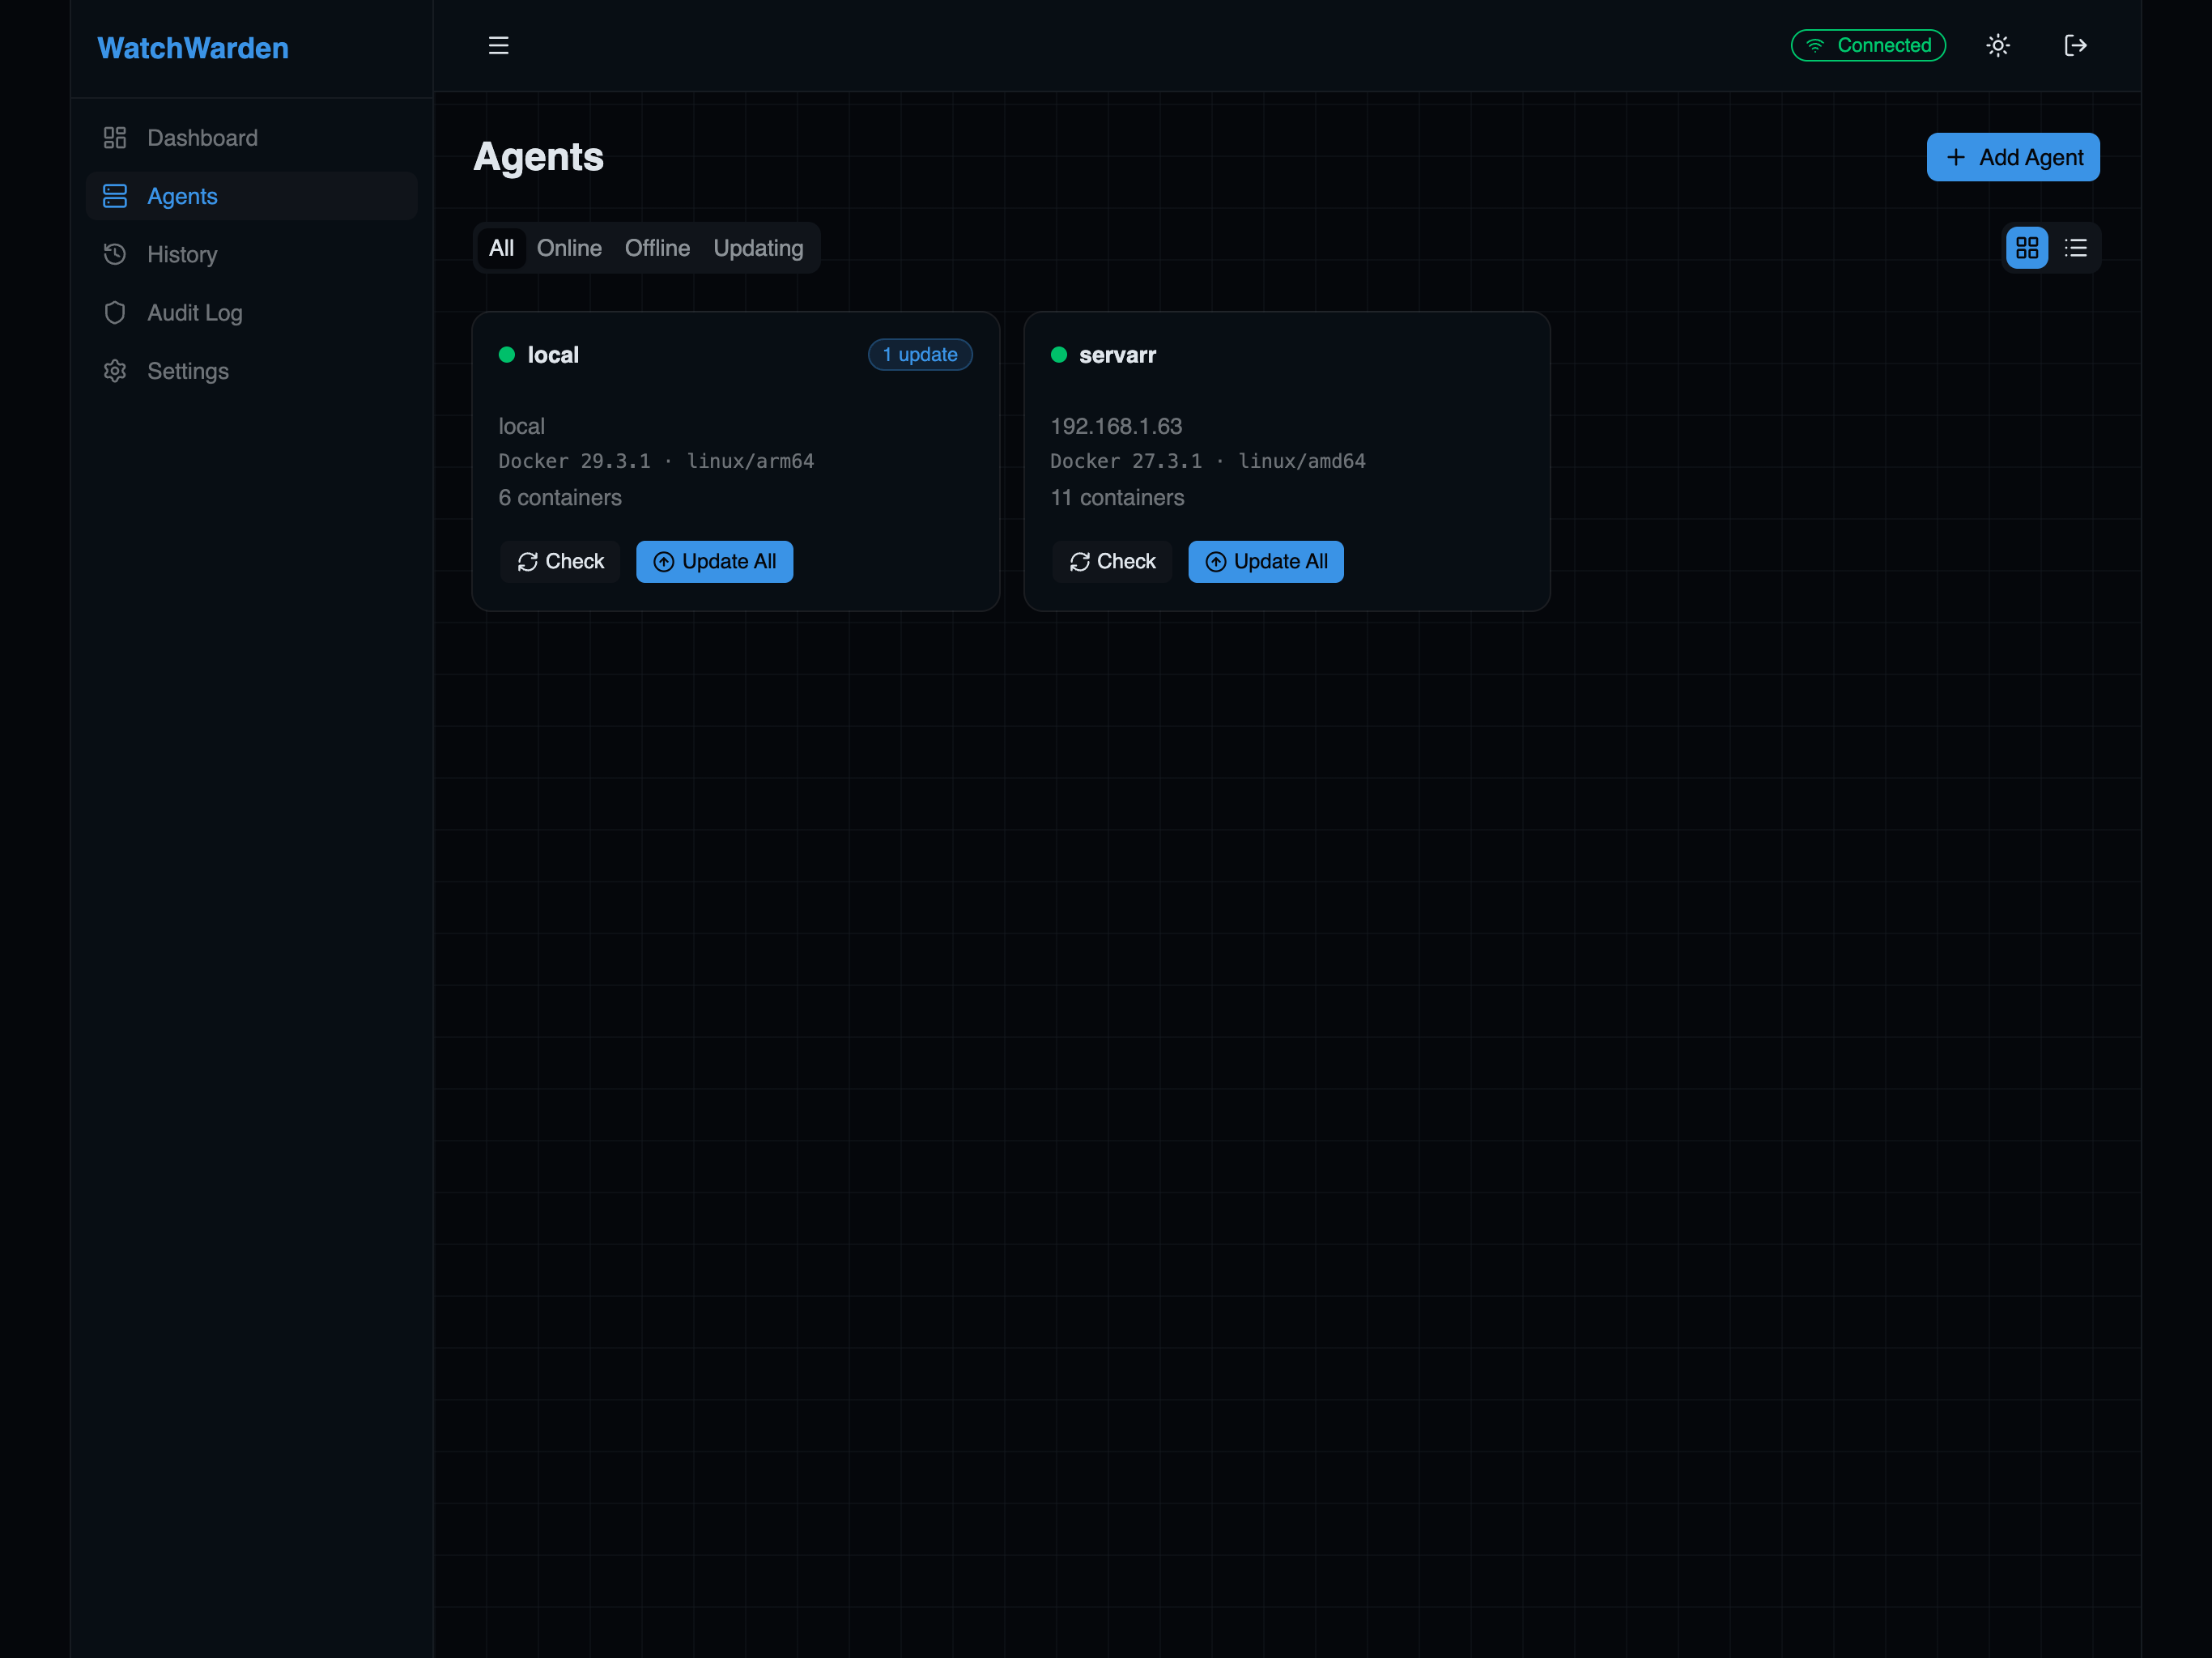
Features:
- Grid and list views — toggle between card layout and compact table
- Status filters — All, Online, Offline, Updating
- Per-agent actions — Check for updates, Update All (only containers with available updates)
- Add Agent — register a new remote Docker host and get a connection snippet
- Agent detail page — click an agent to see all its containers with per-container actions
Agent Detail
Click any agent to see its full container list with live status, health indicators, and per-container actions.
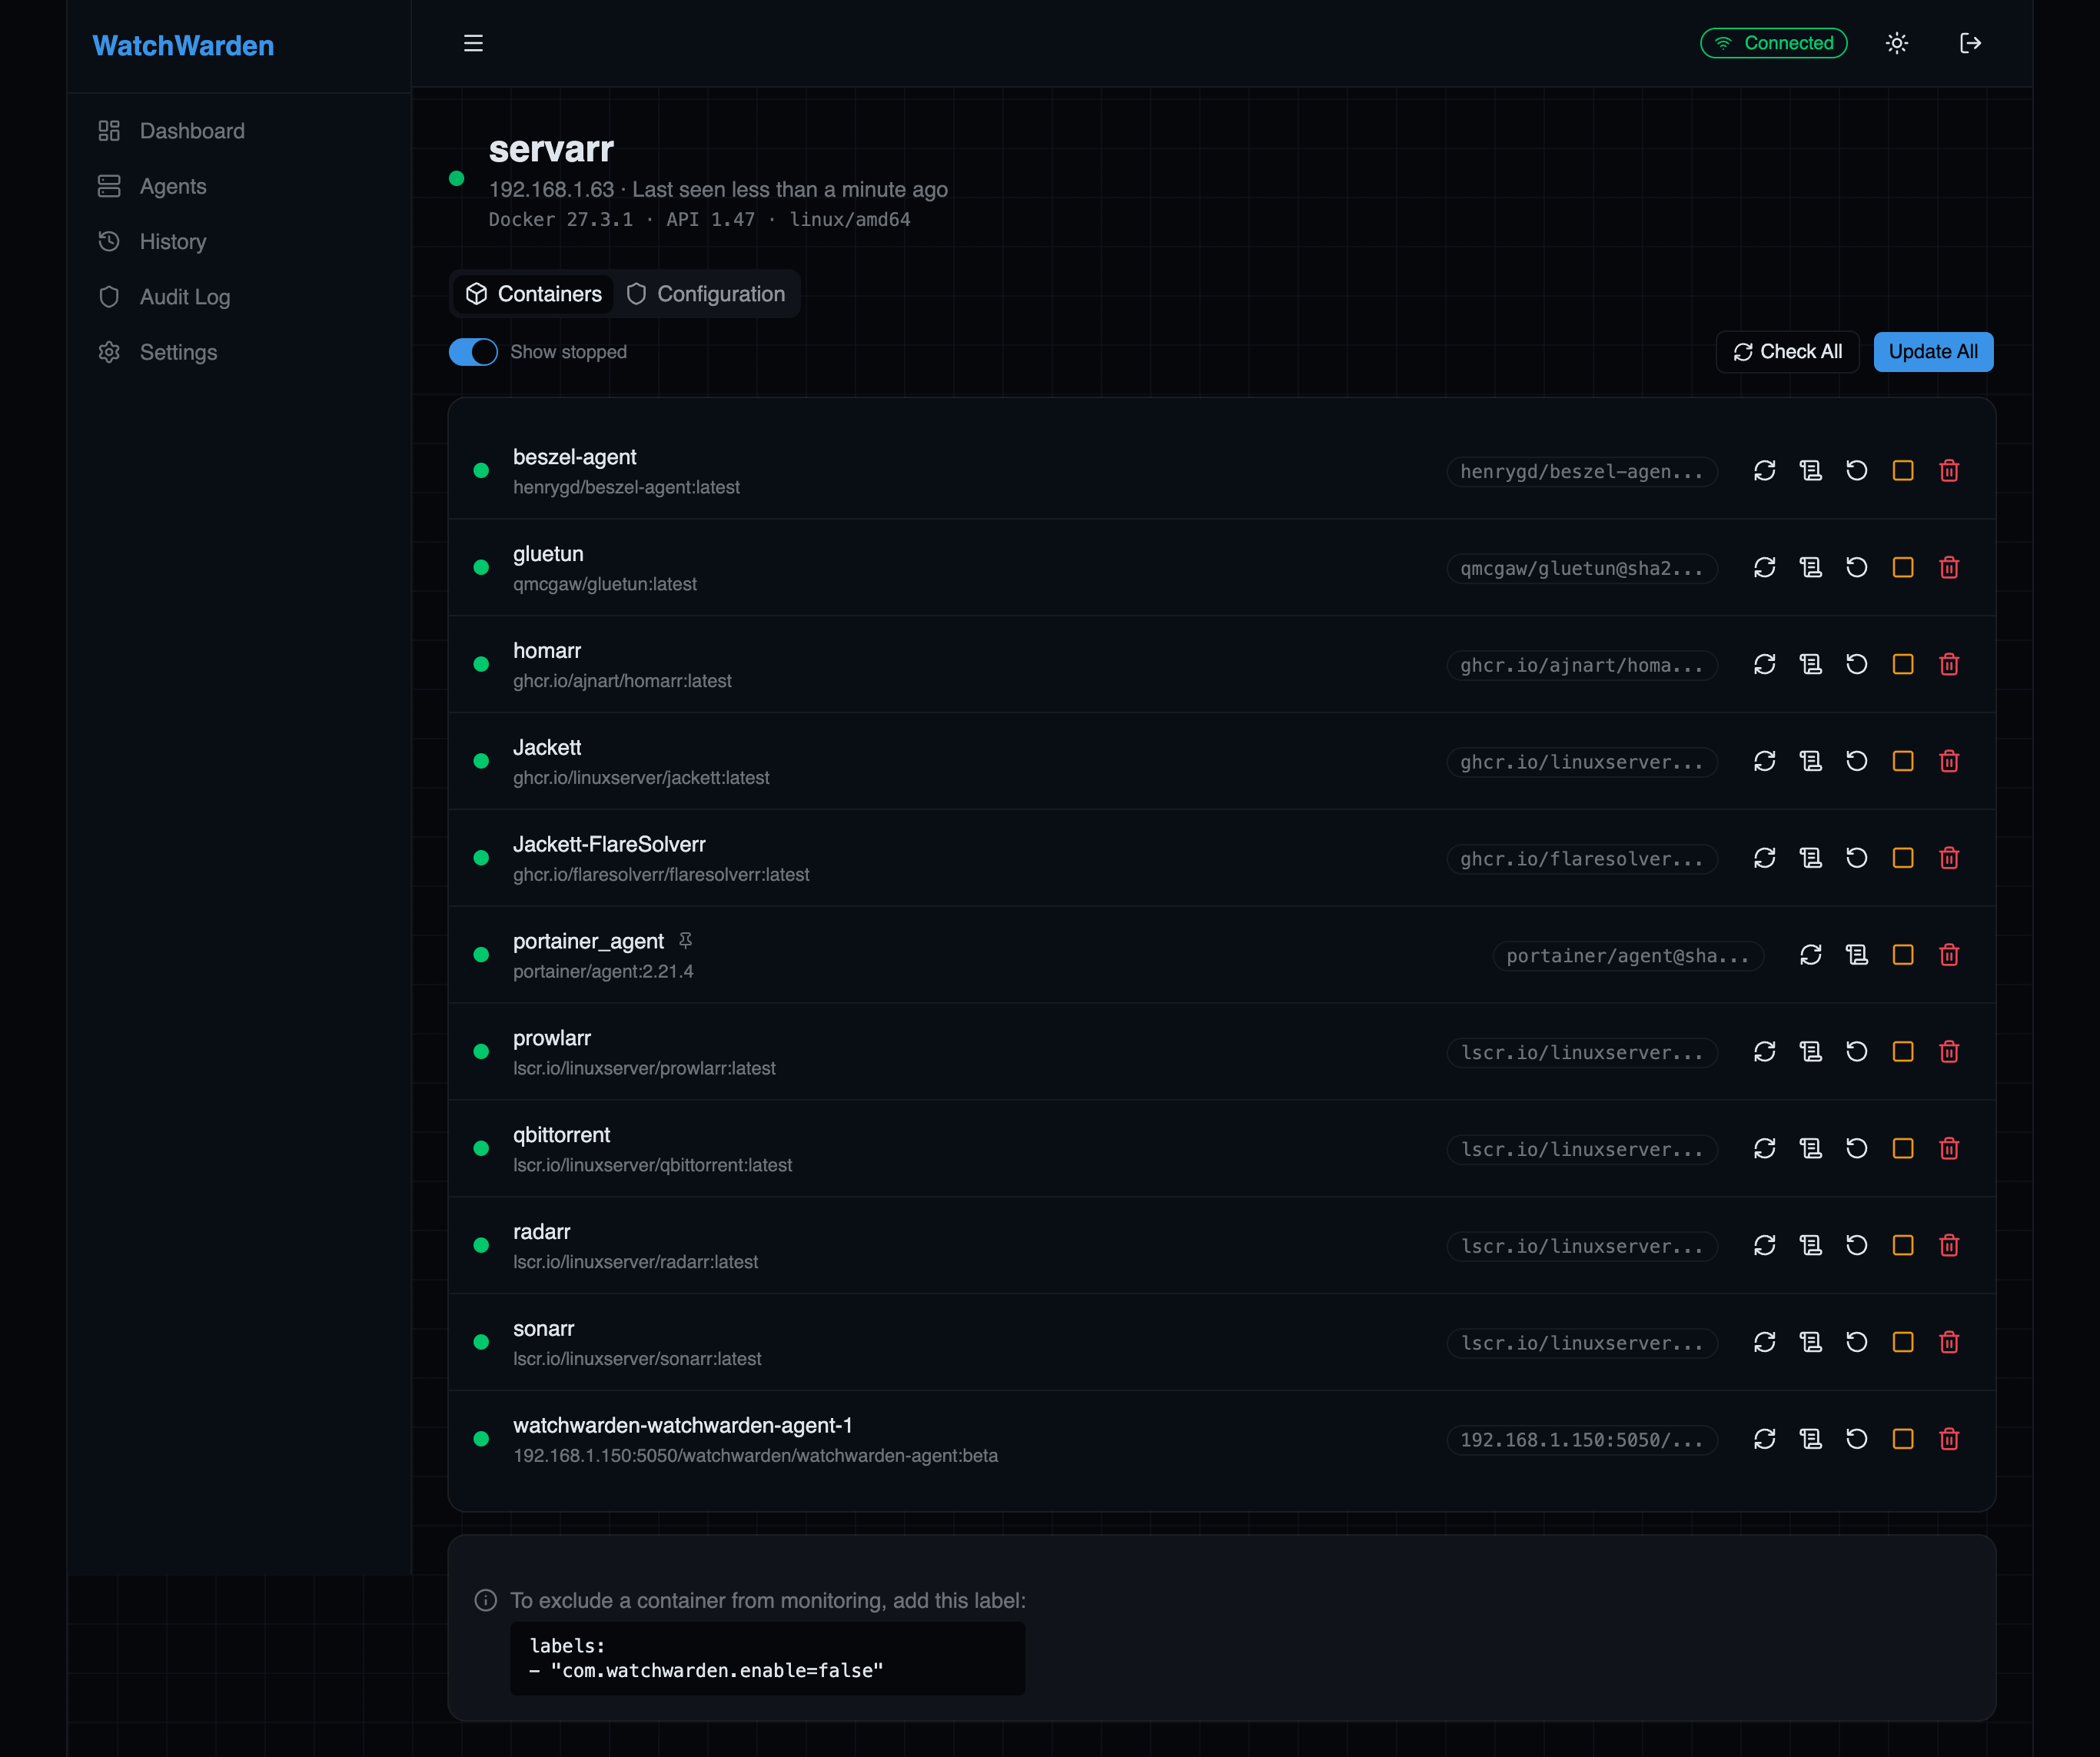
Each container row shows:
- Status dot — running (green), stopped (gray), or checking (spinning)
- Health indicator — healthy, unhealthy, or no healthcheck
- Image and version — current tag or digest
- Update badge — shows when a newer image is available
- Action buttons — Check, Update, Rollback, View Logs, Start/Stop, Delete
- Badges — policy (NOTIFY/MANUAL), update level (PATCH/MINOR), tag pattern (TAG), update group name, priority (p10), pinned, stateful, excluded
Expanding a container row
Click the chevron (›) on the left of any row to expand an inline configuration panel — no modal, no page navigation.
Update Policy (left column):
- Policy — Auto (follow global), Notify only, Manual (skip checks)
- Max update level — restrict updates to Patch, Minor, or Major semver bumps
- Tag pattern — regex filter for registry tags; built-in presets:
semver(^\d+\.\d+\.\d+$),v-semver,date,numeric
Orchestration (right column):
- Update group — group name for ordered batch updates
- Priority — order within the group (lower = first; default 100)
- Depends on — comma-separated container names that must update before this one
Each column has its own Save button. Changes take effect immediately.
Docker label lock
If any of these six fields is set via a Docker Compose label, the field shows an amber "Docker label" lock badge and is read-only — the current label value is displayed with a note pointing to the exact label key. Remove the label from your Compose file to hand control back to the UI. See Label vs UI Precedence.
The Containers and Configuration tabs let you switch between the container list and agent-specific settings.
Agent Configuration
The Configuration tab provides per-agent settings that override the global defaults.
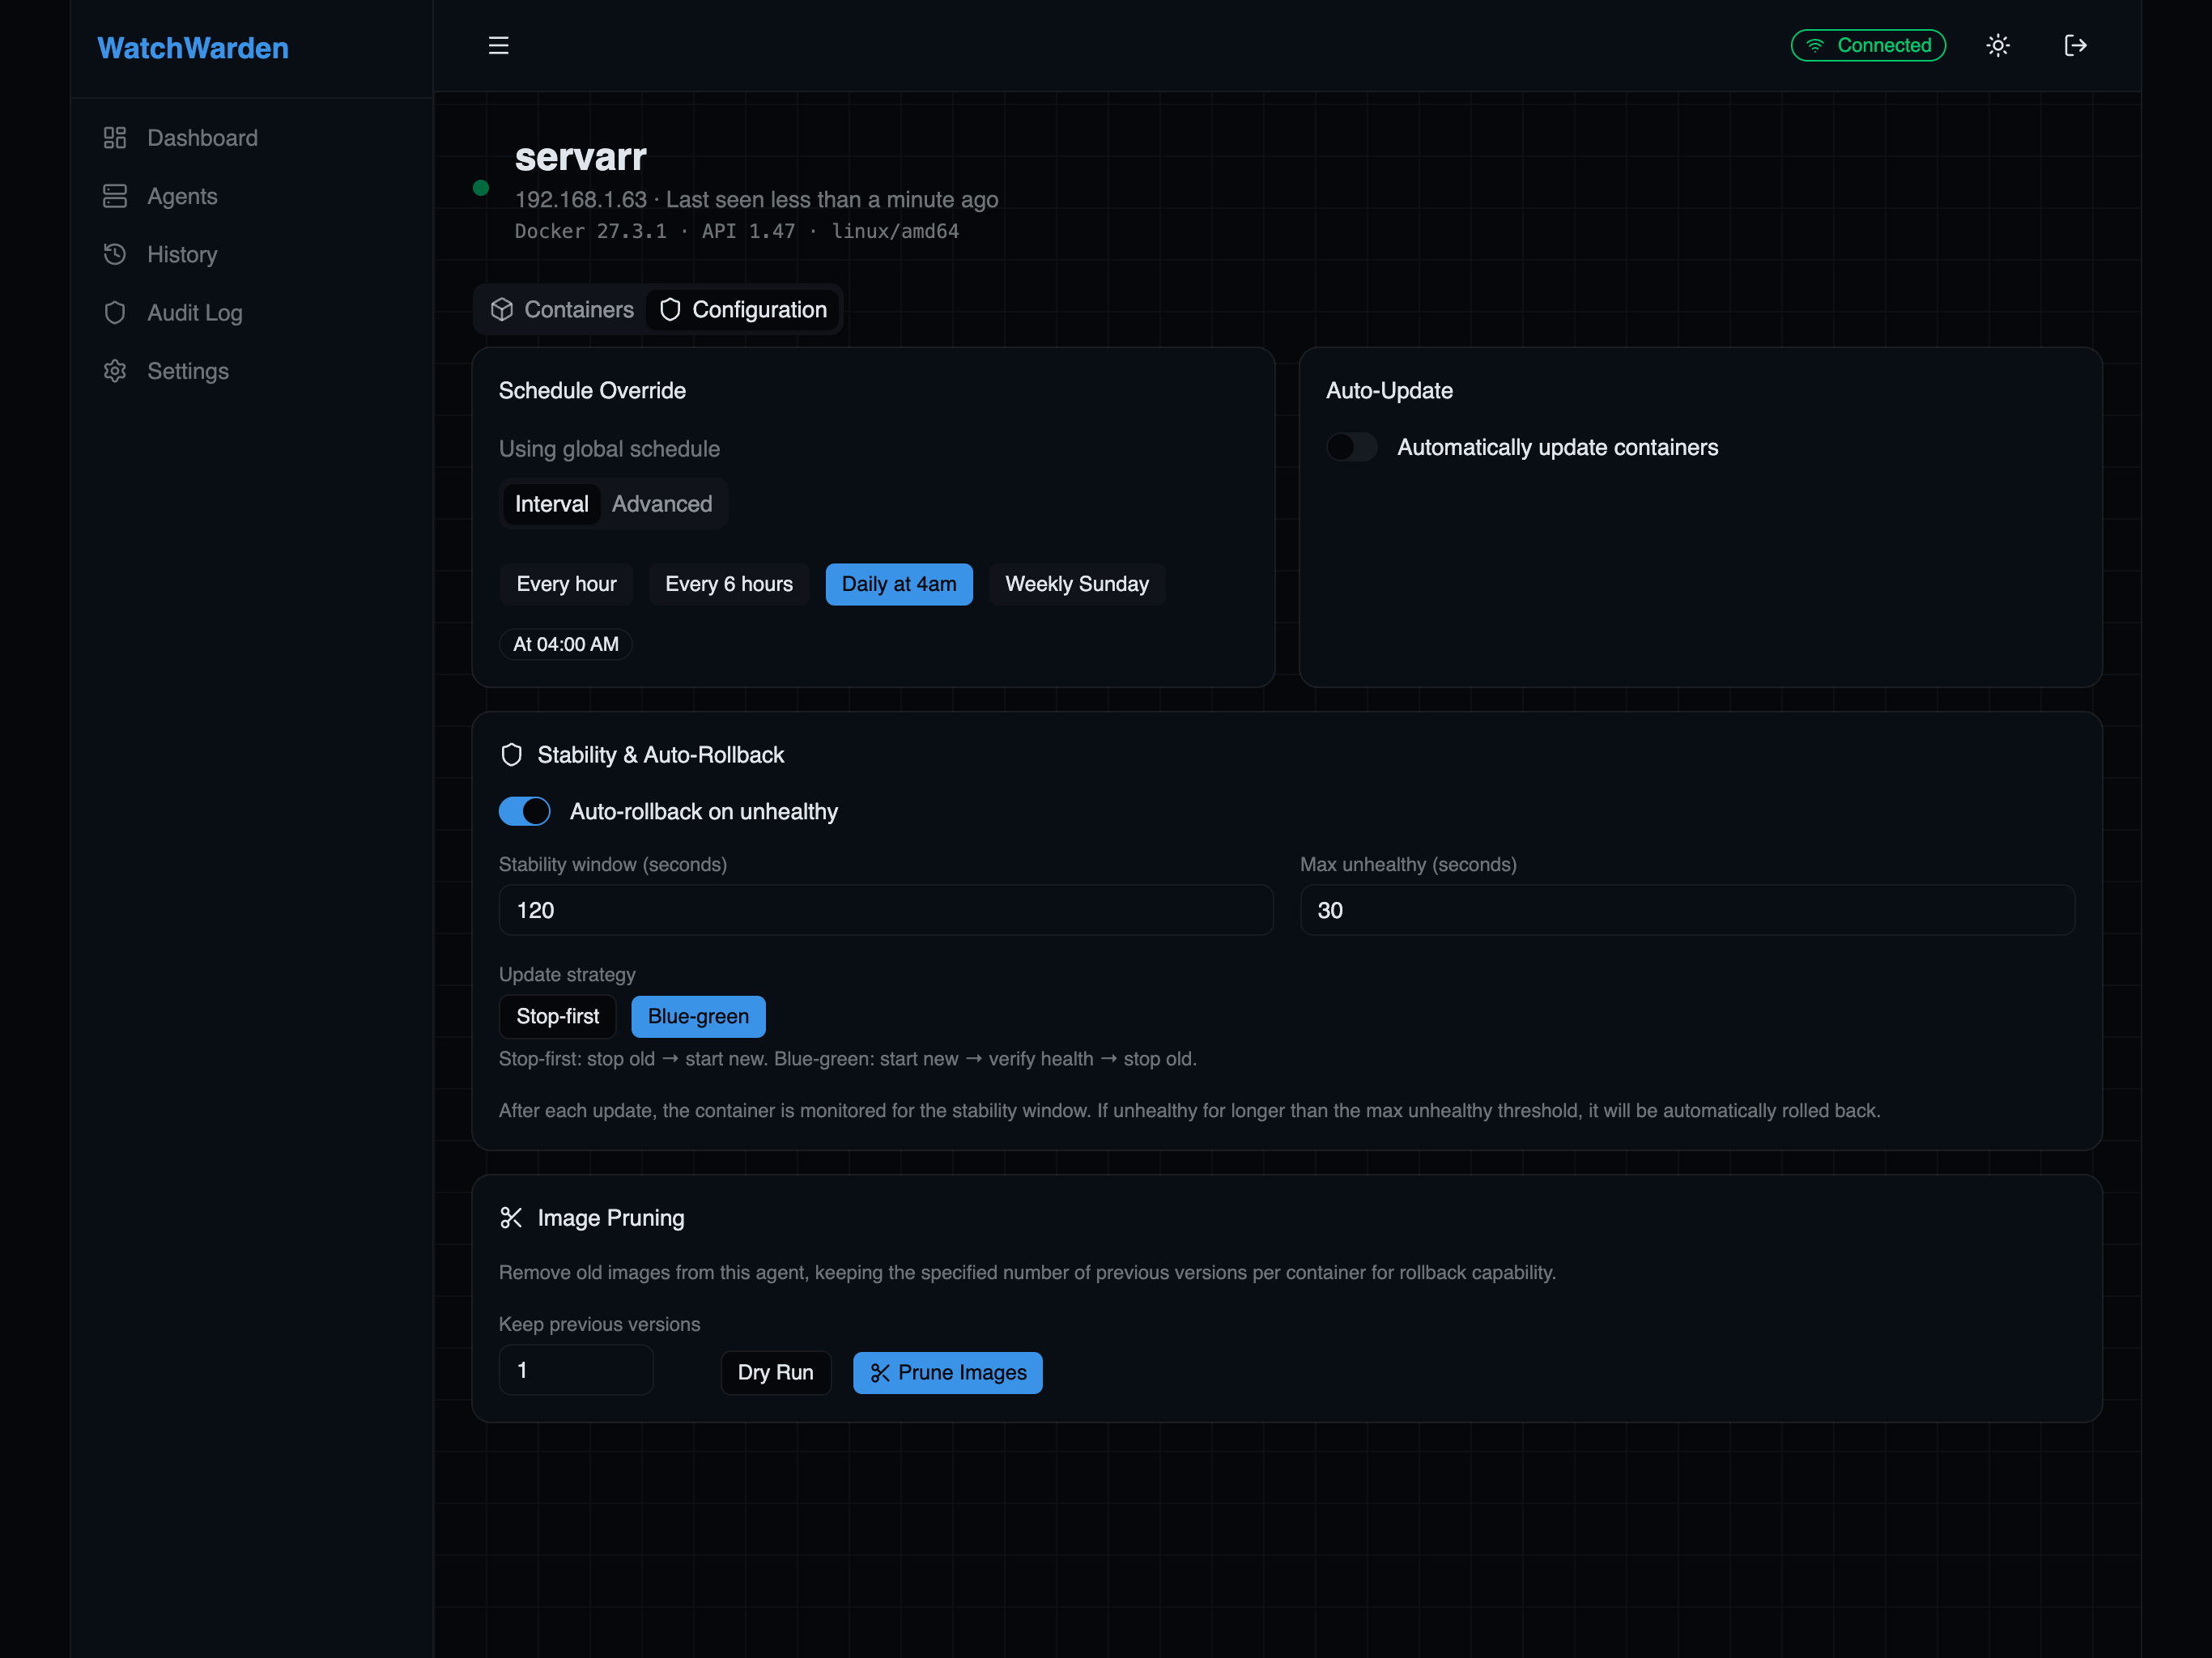
- Schedule Override — set a custom cron schedule for this agent (overrides the global schedule)
- Auto Update — enable automatic updates when new images are detected
- Stability & Auto Rollback — configure health monitoring window, automatic rollback, and minimum update age (hold back auto-updates until a new image has been available for N hours)
- Update Strategy — choose between stop-first (default) or start-first (blue-green) deployment
- Image Pruning — clean up old images after successful updates to reclaim disk space
Tip: To exclude a container from monitoring, add the label
com.watchwarden.enable=falseto it.
Update History
Full audit trail of every container update, rollback, and failure across all agents.
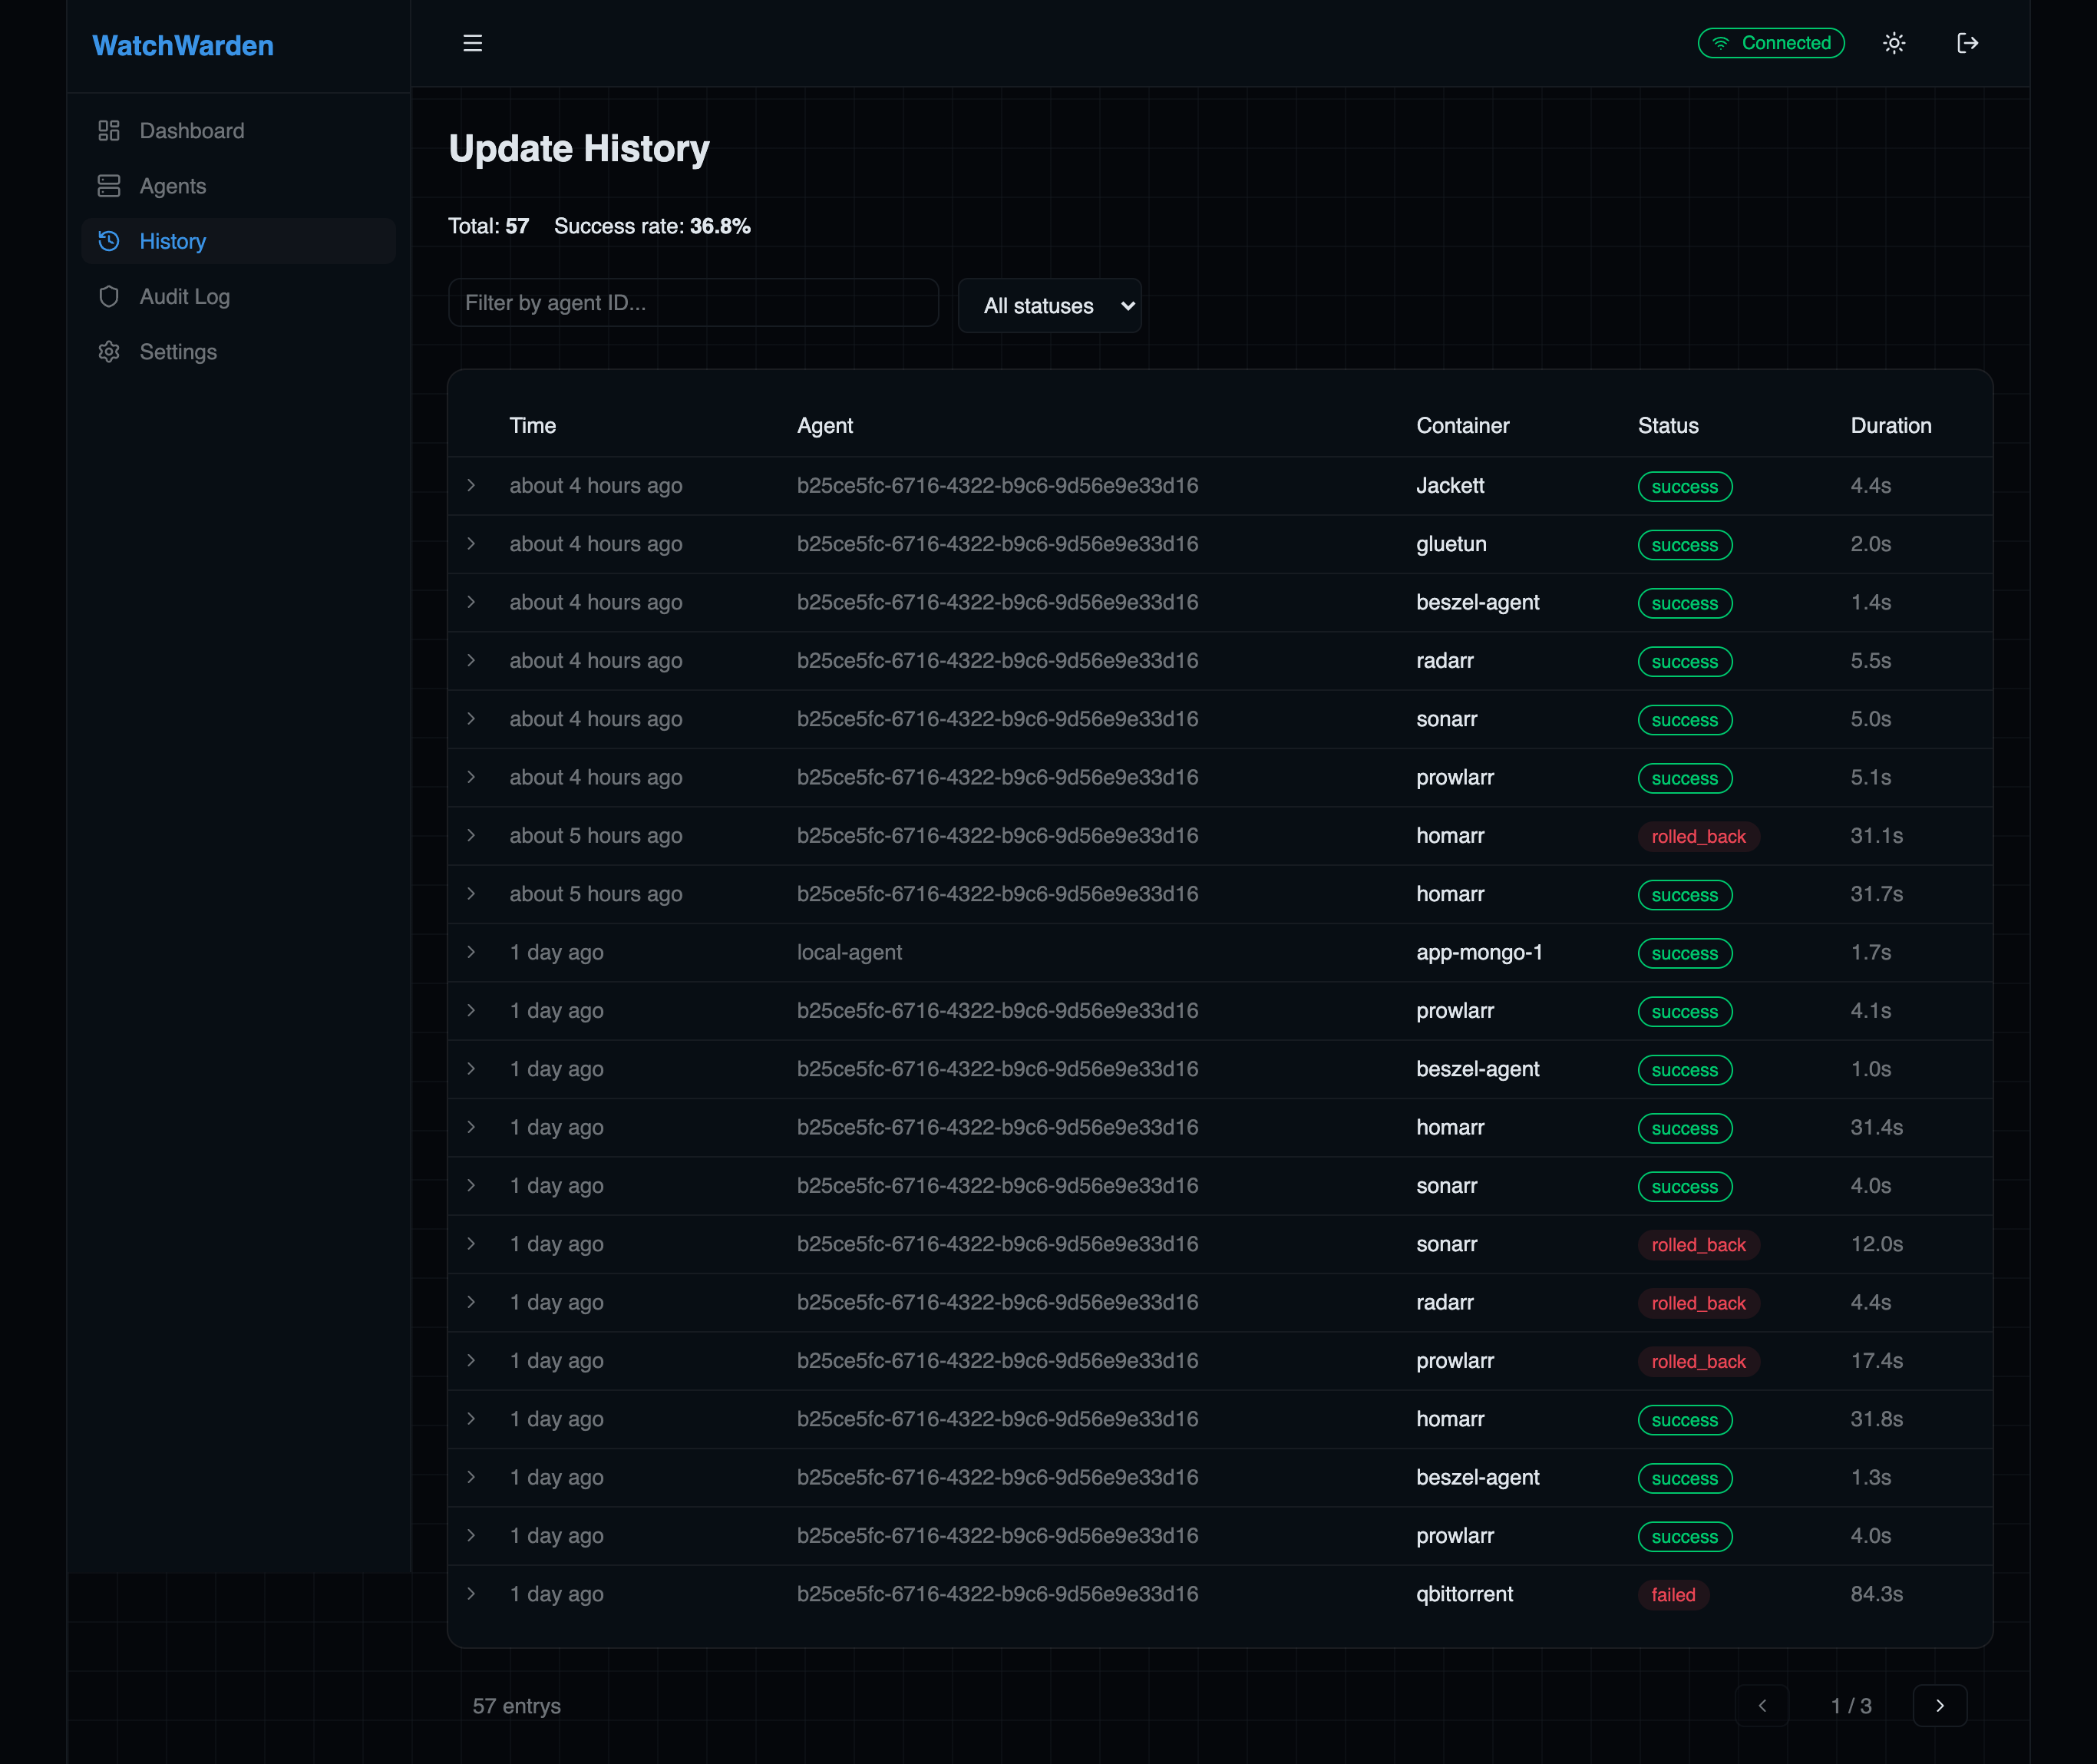
Features:
- Expandable rows — click to reveal old/new image versions, duration, and error messages
- Image tags — expanded rows show
image:tag (sha256:short…)format; old records without tag data fall back to the plain digest - Image diff badge — if the update had configuration changes (env, ports, entrypoint, volumes), a diff badge appears in the expanded row; click it to open the full diff view
- Filters — by agent ID and status (success, failed, rolled back)
- Pagination — browse through all historical updates
- Success rate — overall success percentage displayed at the top
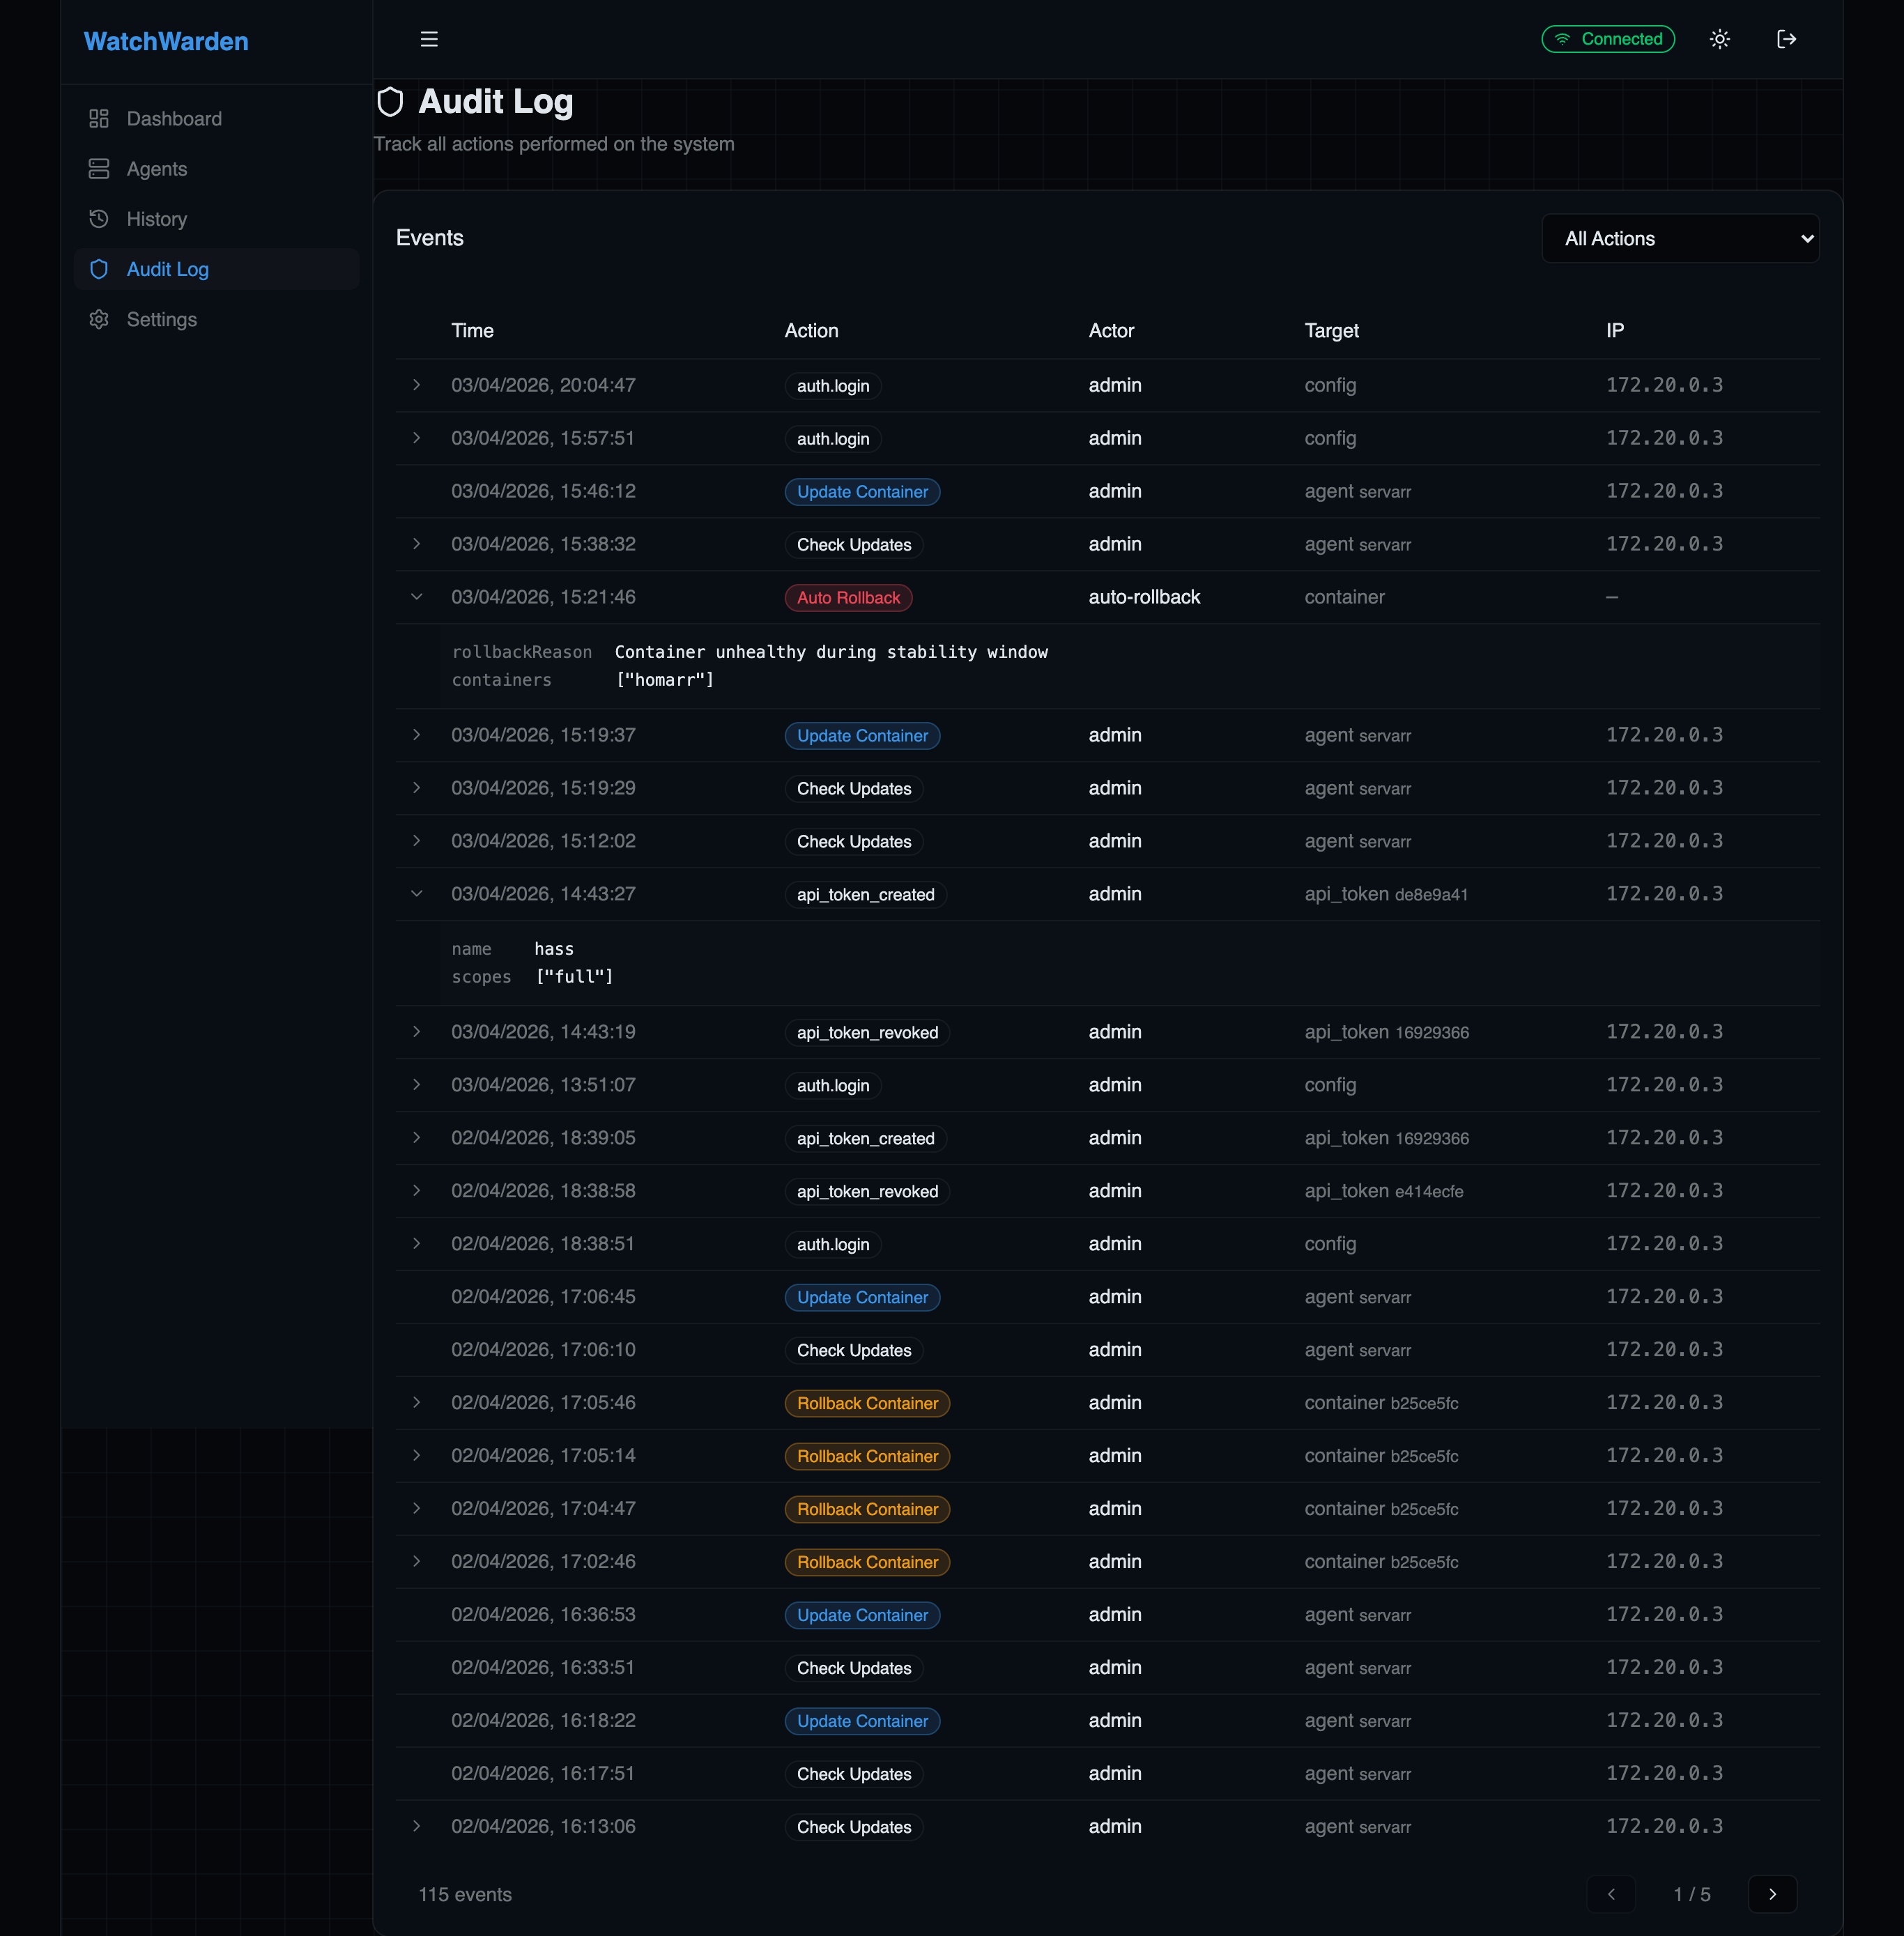
Audit Log
Complete trail of all administrative actions: logins, config changes, agent registration, token management, container operations. Each entry shows the actor, action, target, IP address, and timestamp with expandable details.
Settings
General
Configure global update schedule, startup behavior, admin password, and agent registration.
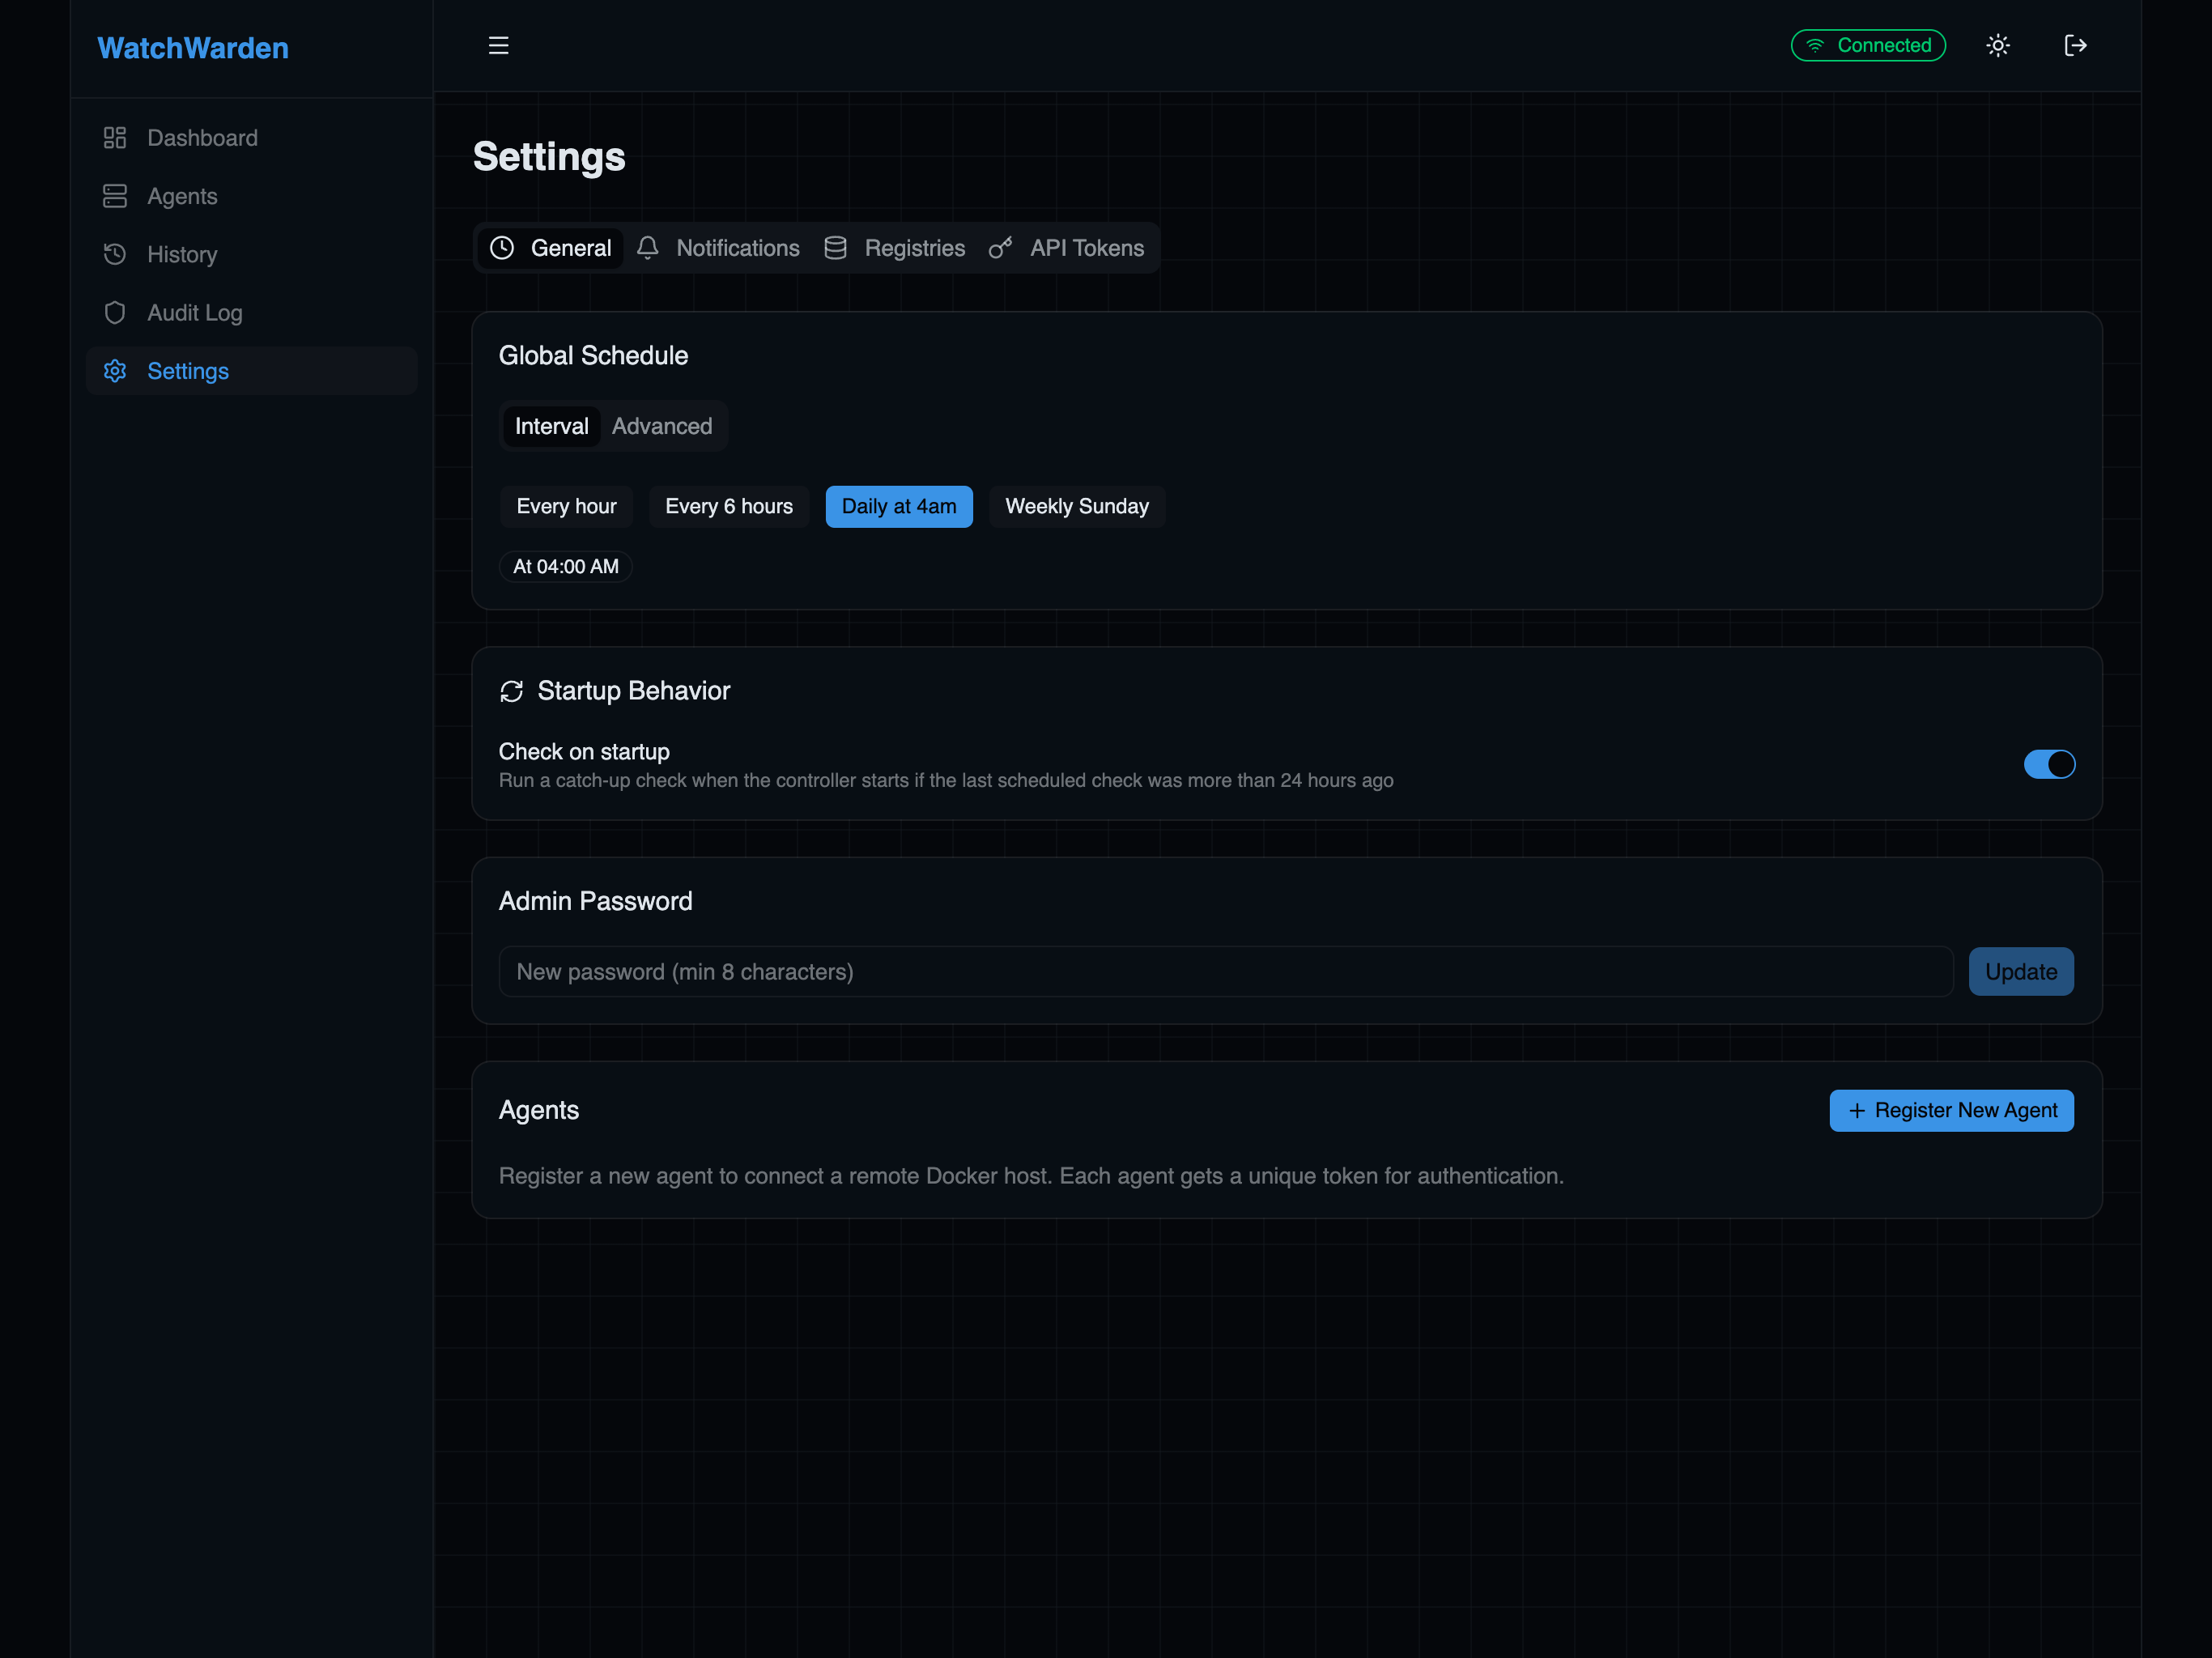
- Global Schedule — cron expression picker with presets (hourly, daily, weekly)
- Default Update Level — global semver cap (
patch,minor,major, or no restriction) applied to all containers without a per-container level set - Check on startup — catch-up check if the last scheduled check was more than 24 hours ago
- Admin Password — change the dashboard login password
- Recovery Mode — time-limited window for automatic agent re-registration after database loss (see below)
- Register New Agent — generate a token and get a ready-to-use docker run snippet
Recovery Mode
If the controller's database is lost (e.g. the PostgreSQL volume is accidentally deleted), all agent registrations are gone and deployed agents can no longer authenticate. Recovery mode lets you restore connectivity without manually re-registering every agent.
How it works:
- Go to Settings → General → Recovery Mode
- Click Enable and choose a duration (5, 15, 30, or 60 minutes)
- Confirm in the dialog — recovery mode activates with a visible countdown
- Already-deployed agents will automatically reconnect and re-register using their existing tokens
- Recovery mode expires automatically when the timer runs out, or you can disable it manually
Security:
- Off by default — normal operation uses strict bcrypt token authentication
- Time-bounded — auto-expires after the chosen duration
- Token required — agents must present a valid 64-character hex token (not arbitrary strings)
- Rate limited — maximum 20 recovery registrations per window
- Audit logged — every auto-registration is recorded with IP address, agent name, and hostname
- Flagged for review — recovery-registered agents display an orange "Recovery" badge in the Agents page so you can verify they are legitimate
Only enable recovery mode immediately after a database loss. During the recovery window, any machine on your network with a valid-format token can register as an agent. Keep the window as short as possible and review the Audit Log afterward.
Notifications
Configure notification channels for update alerts, success/failure reports, and auto-rollback events.
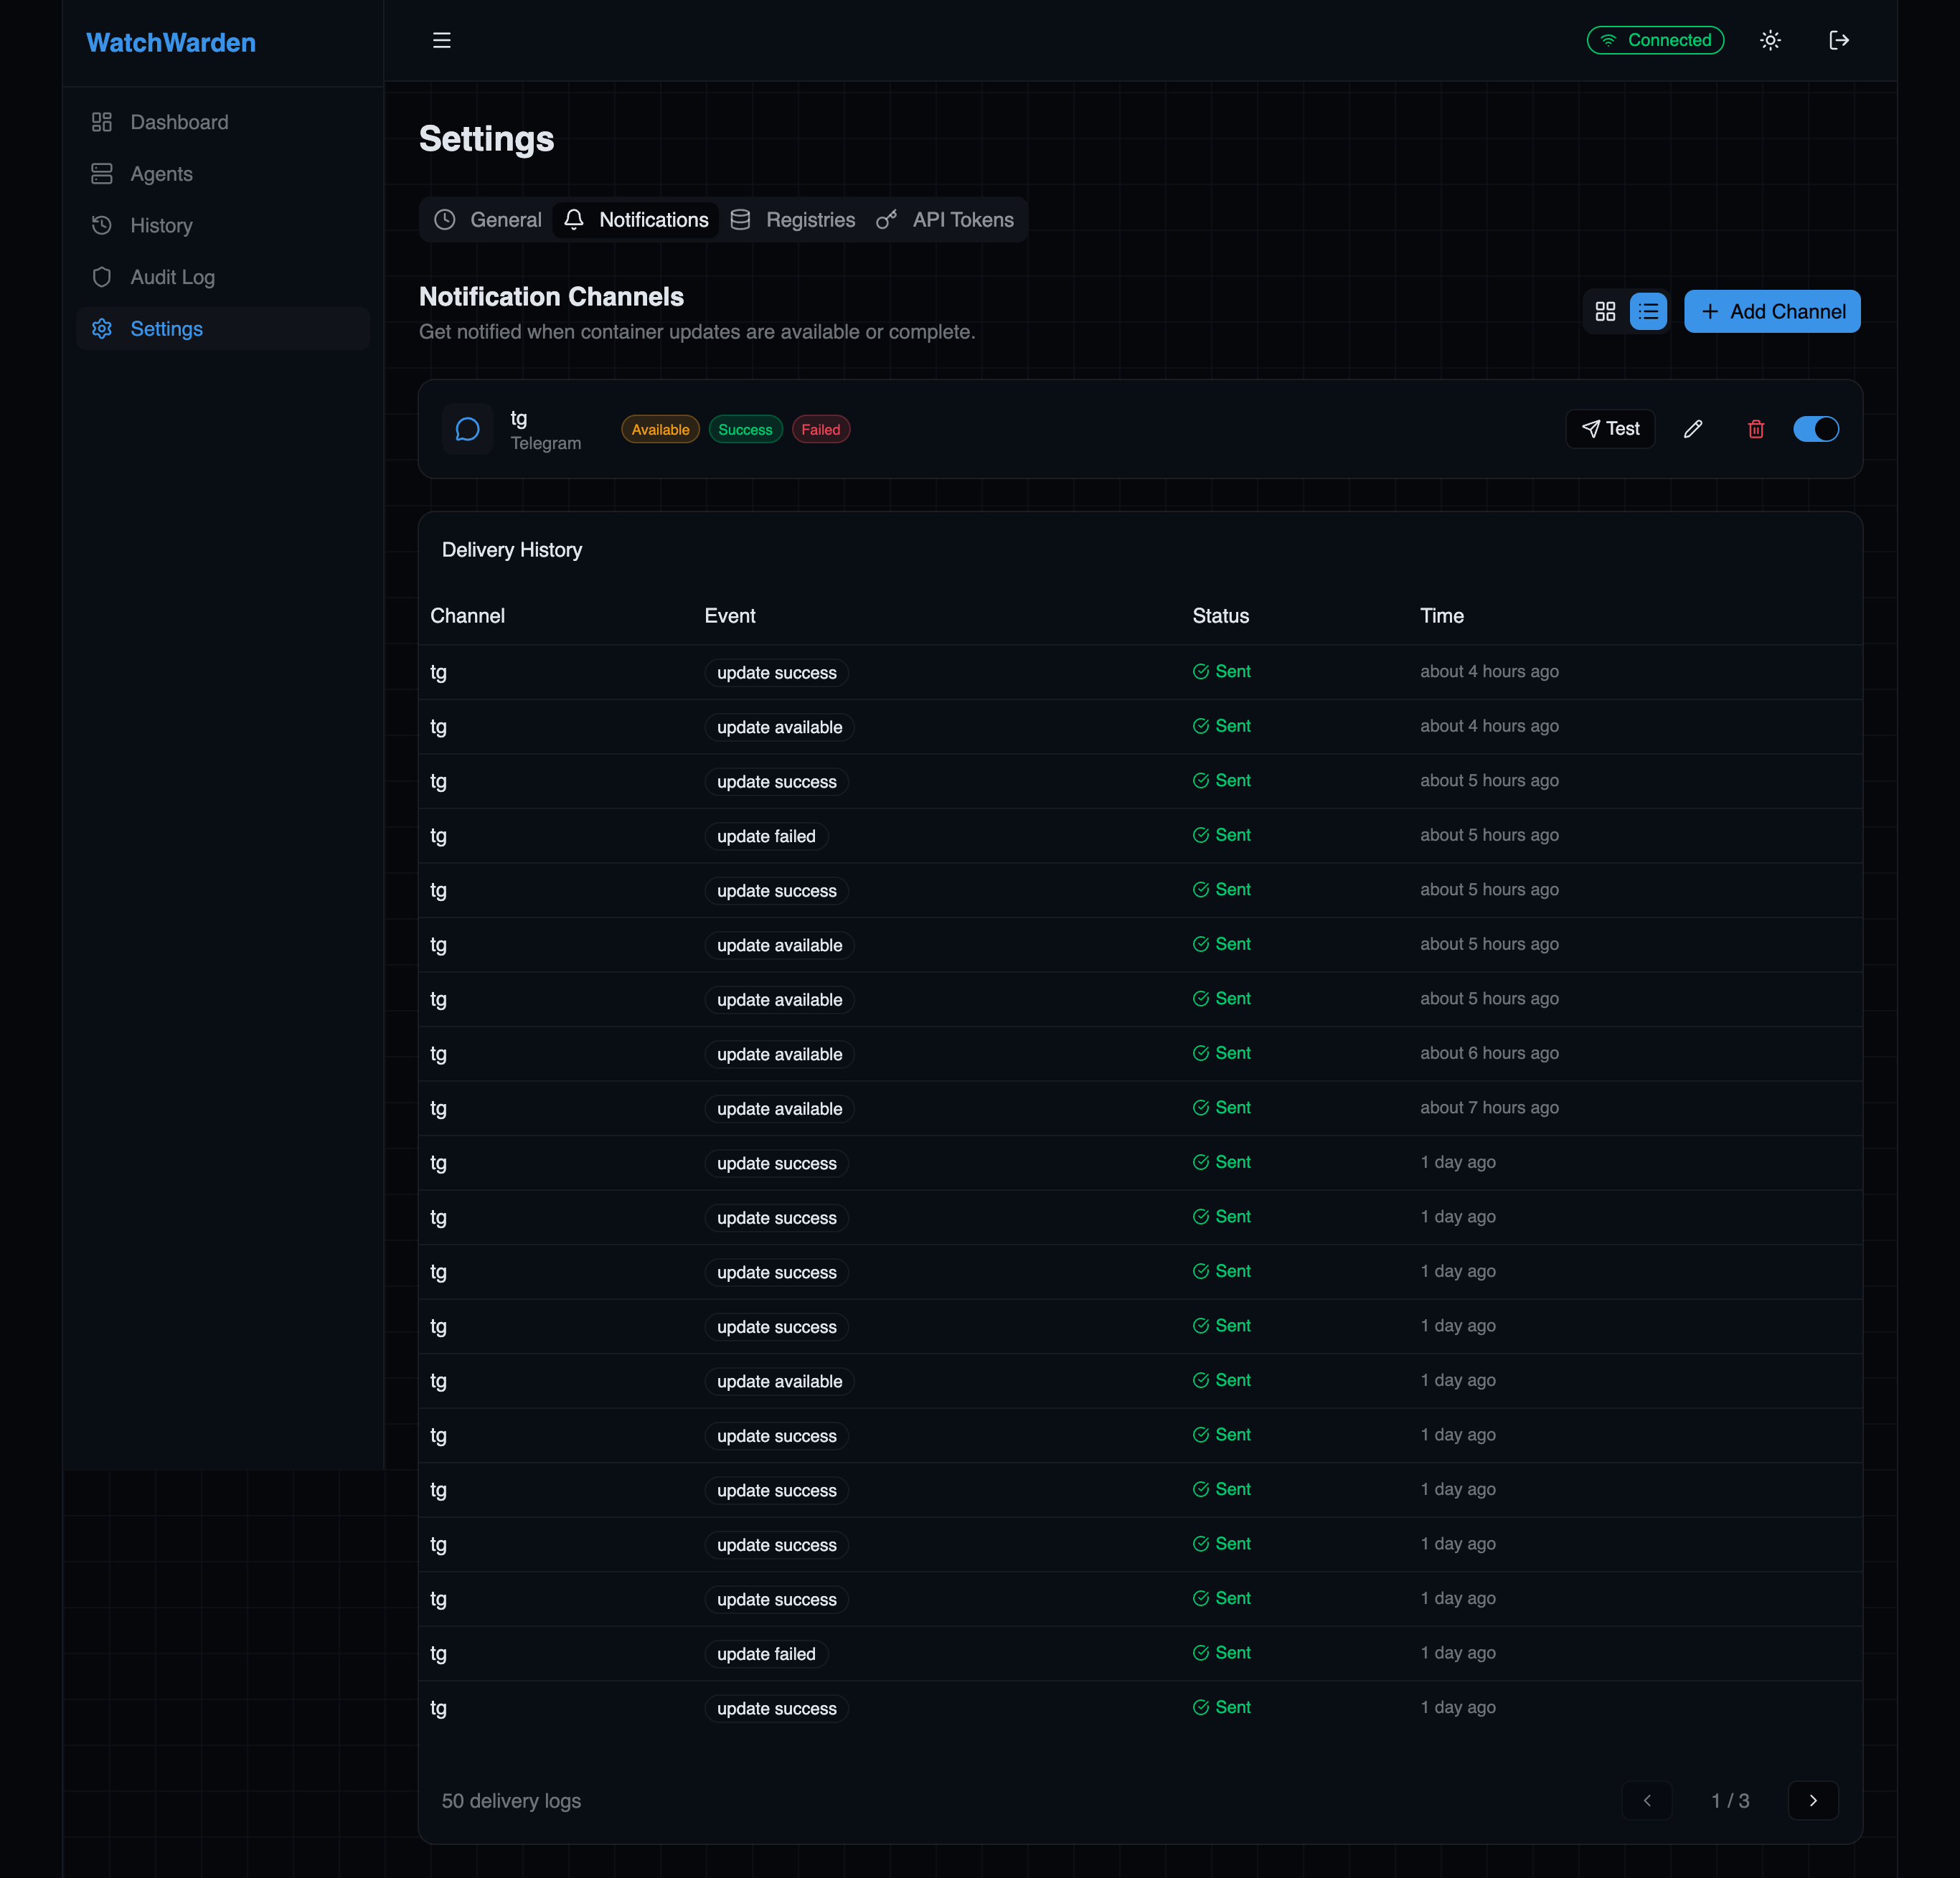
Supported channels:
- Telegram — bot token + chat ID
- Slack — incoming webhook URL
- Webhook — generic HTTP POST to any URL
- ntfy — self-hosted or ntfy.sh push notifications
Each channel supports custom templates and per-event filtering (updates available, update success, update failed).
Registries
Manage credentials for private Docker registries. Credentials are encrypted at rest with AES-256-GCM and automatically synced to all connected agents.
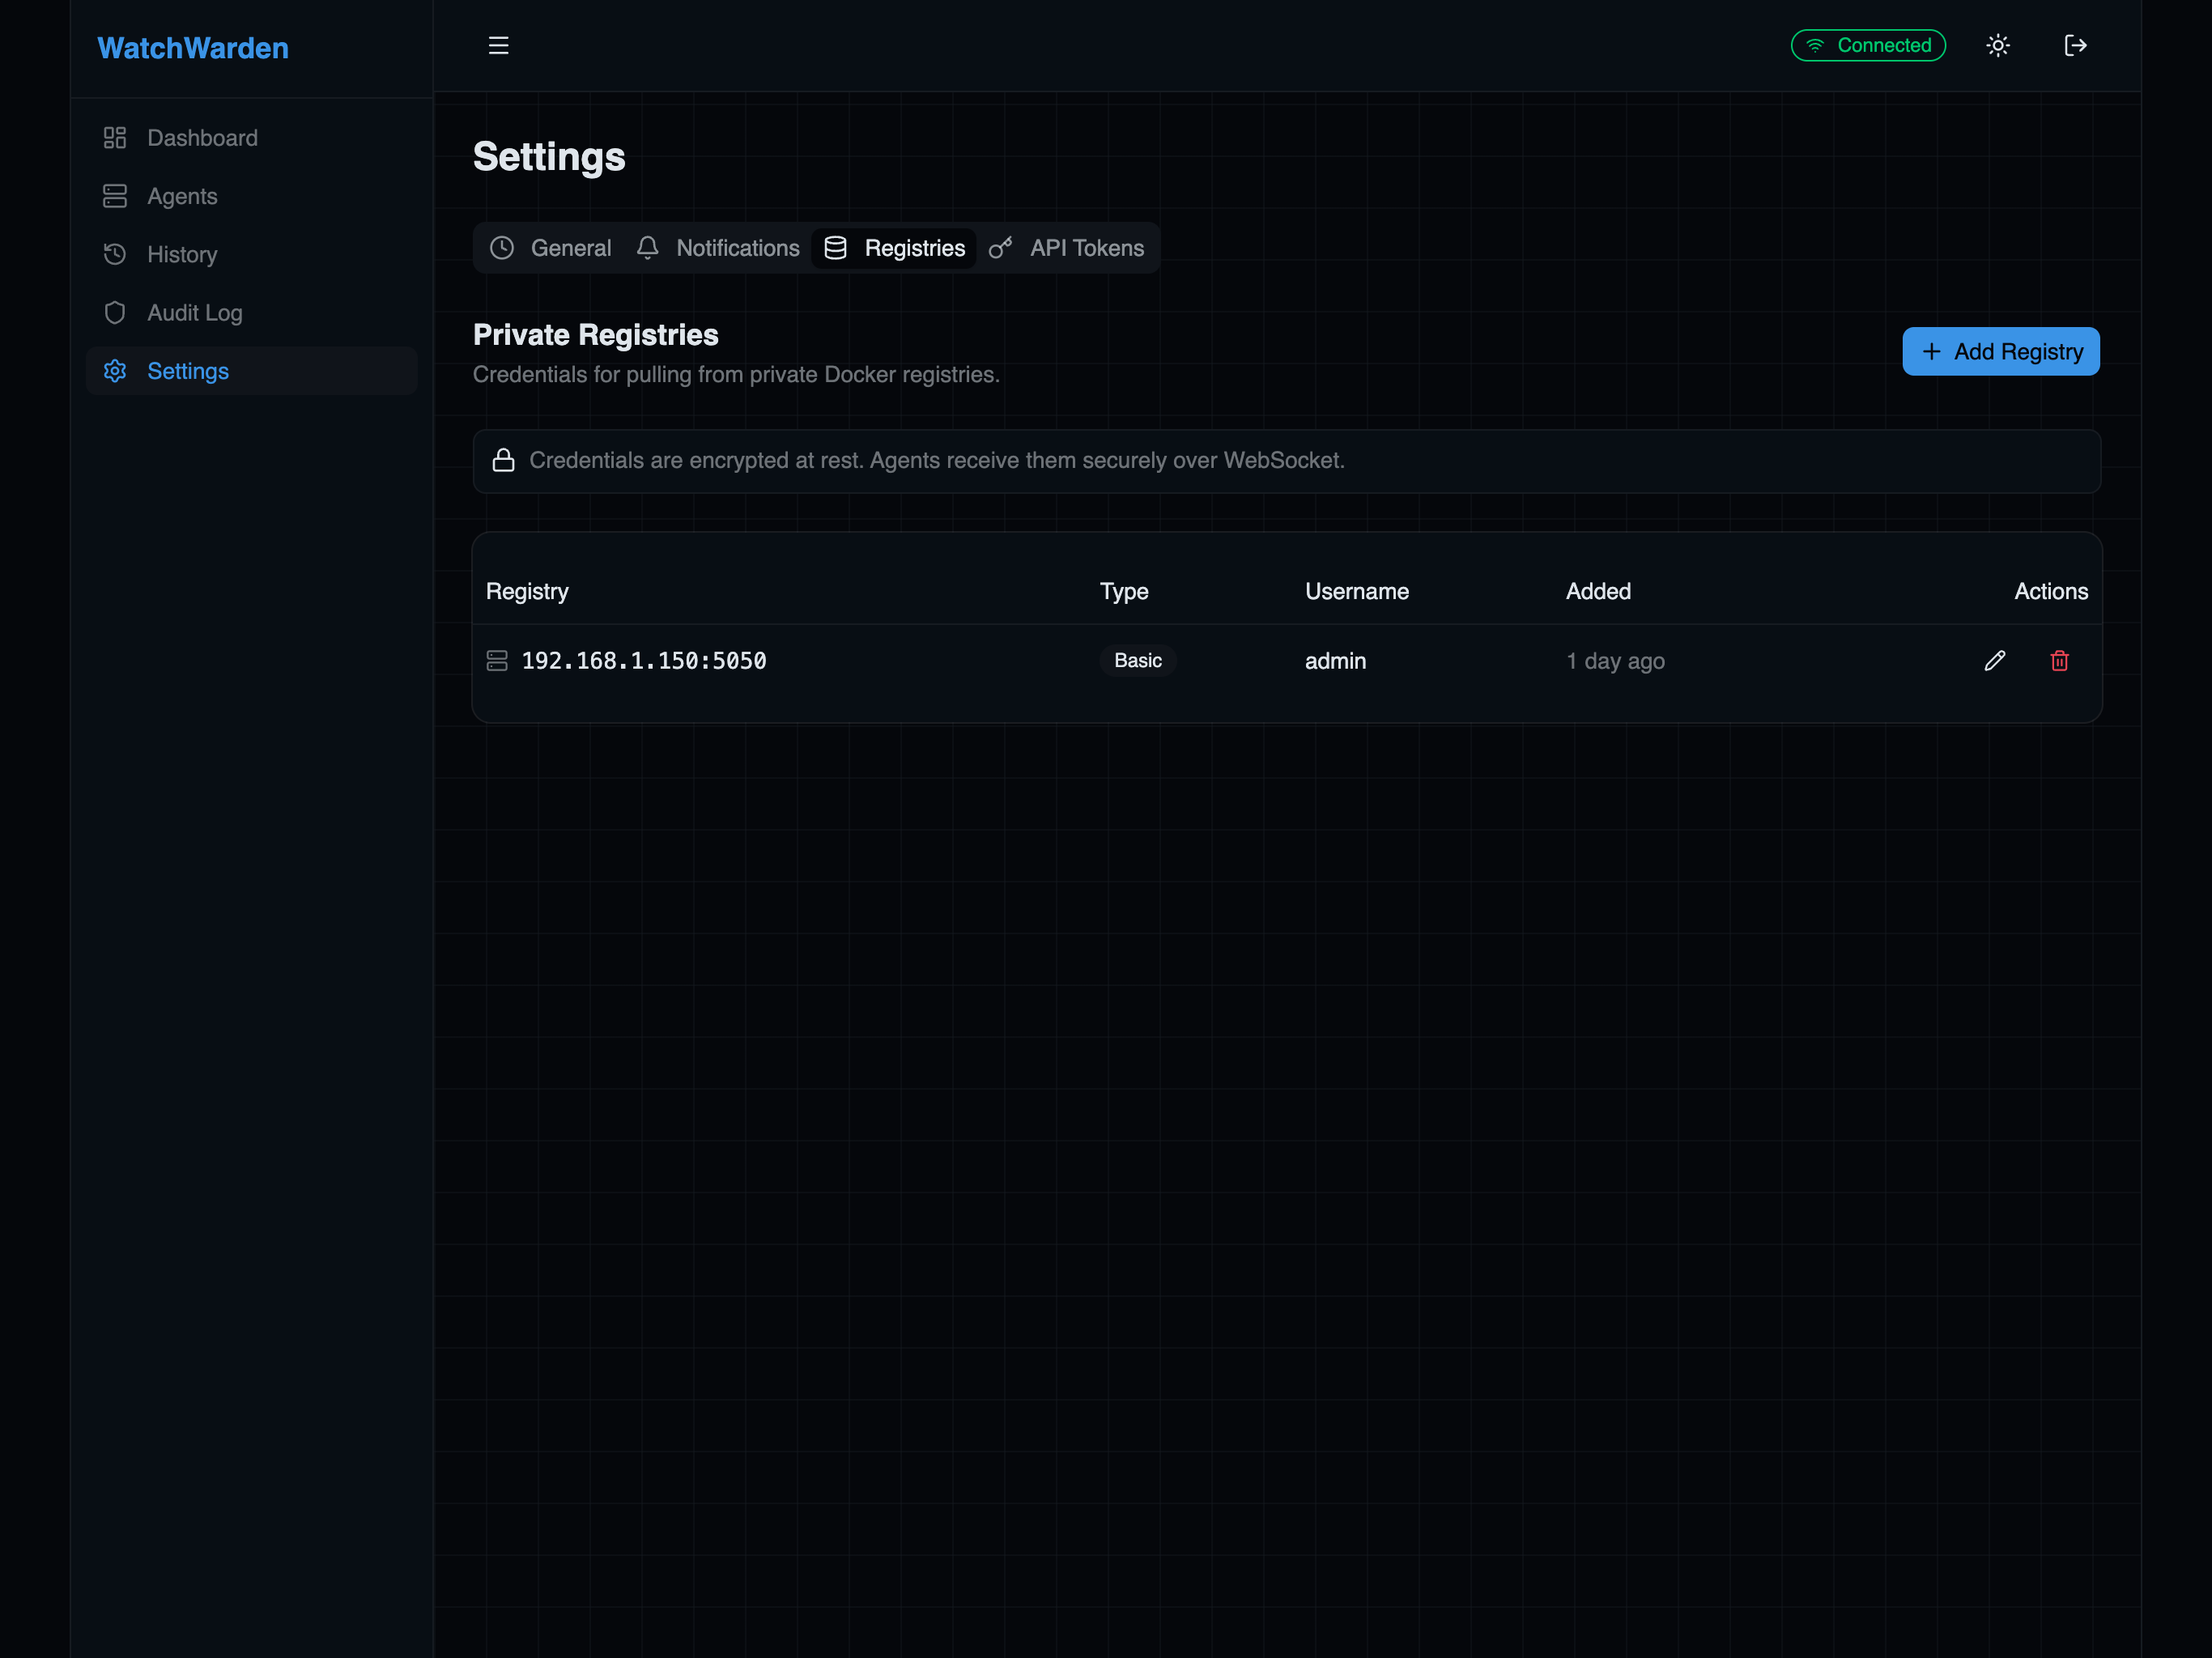
Supported auth types:
- Basic — username/password (Docker Hub, self-hosted registries)
- ECR — AWS Elastic Container Registry
- GCR — Google Container Registry
- ACR — Azure Container Registry
API Tokens
Create and manage API tokens for external integrations like Home Assistant, CI pipelines, or custom scripts.
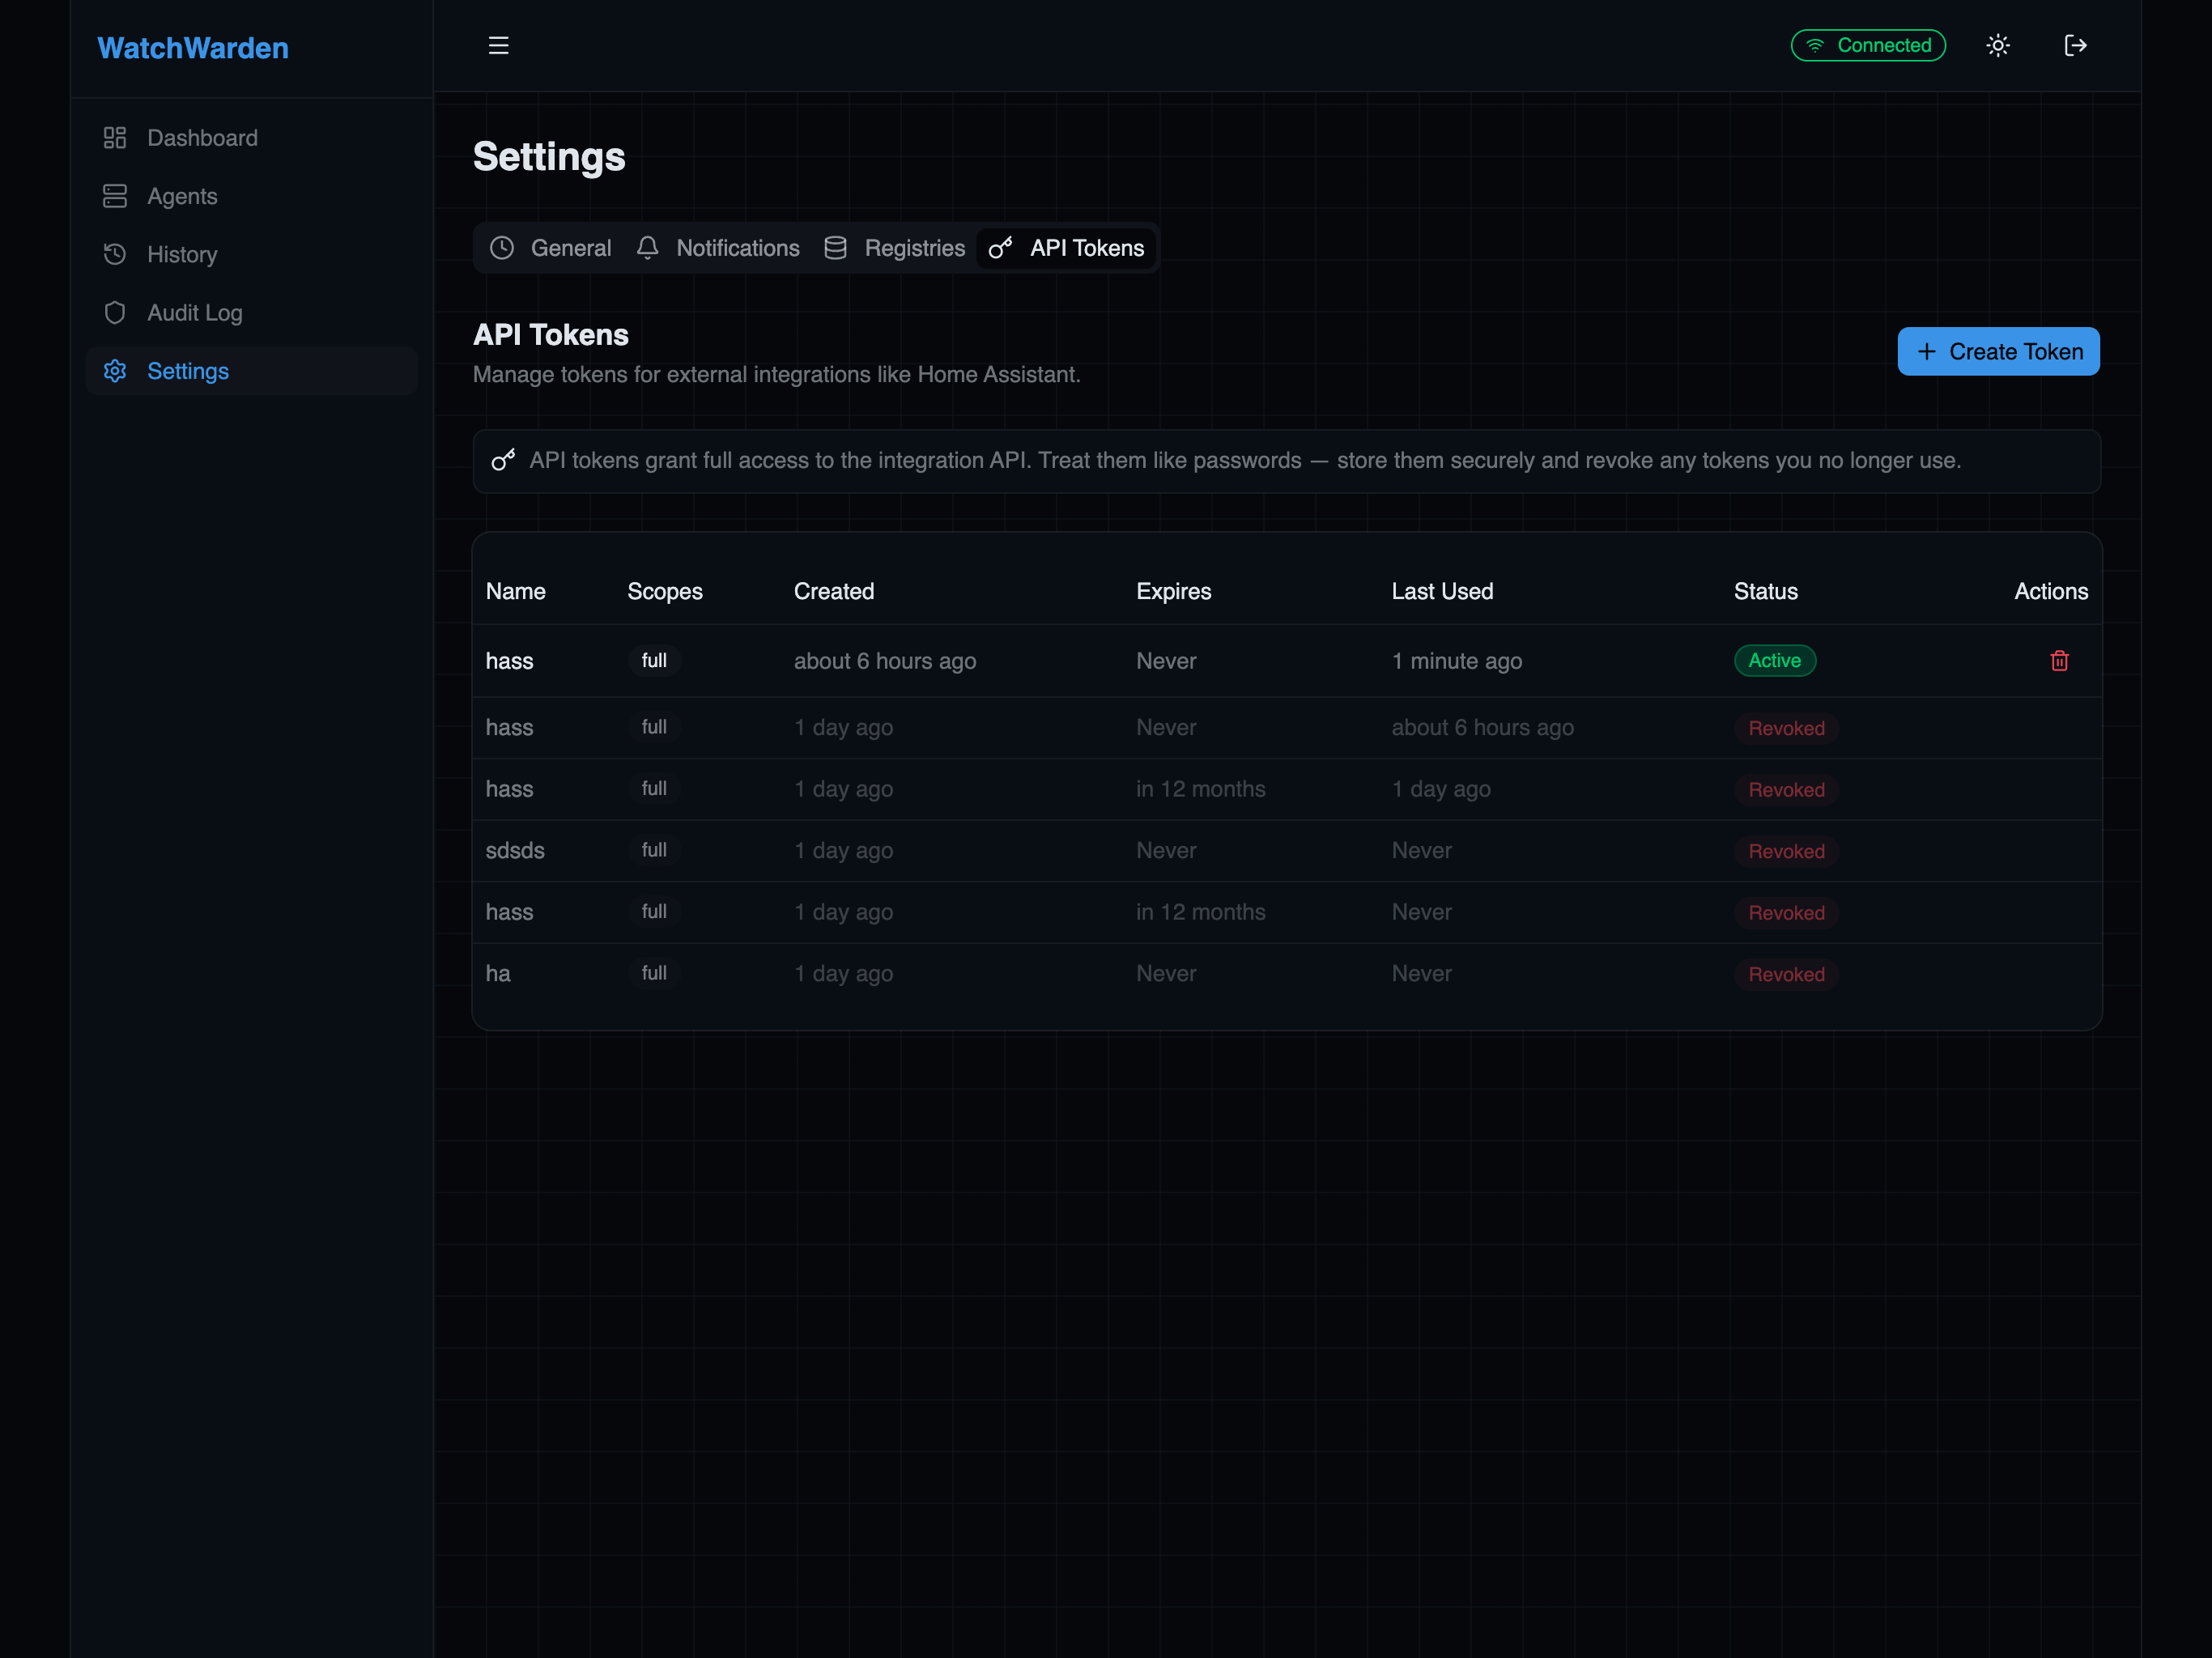
Features:
- Scoped access — choose the permission level when creating a token:
- Full access — read and write to all integration endpoints (default, recommended for Home Assistant)
- Read only — can only query summary and container data (GET endpoints)
- Write only — can only trigger actions like check, update, and rollback (POST endpoints)
- Optional expiration — 30 days, 90 days, 1 year, or never
- One-time display — token is shown only once at creation, then only the metadata is visible
- Revocation — immediately invalidate a compromised token
- Audit logged — all token create/revoke actions are recorded
Use Full access for Home Assistant and tools that need both monitoring and actions. Use Read only for dashboards and monitoring scripts that should never trigger updates. Use Write only for CI pipelines that trigger updates but don't need to read container state.
Theme
The UI supports both dark and light themes. Toggle between them using the sun/moon icon in the top-right corner of the header bar.
- Dark theme (default) — designed for always-on dashboards and low-light environments
- Light theme — uses the same blue accent color with light backgrounds for daytime use
The theme preference is saved in your browser and persists across sessions.
About & Diagnostics
The About tab in Settings shows version information, debug logging controls, and diagnostics tools.
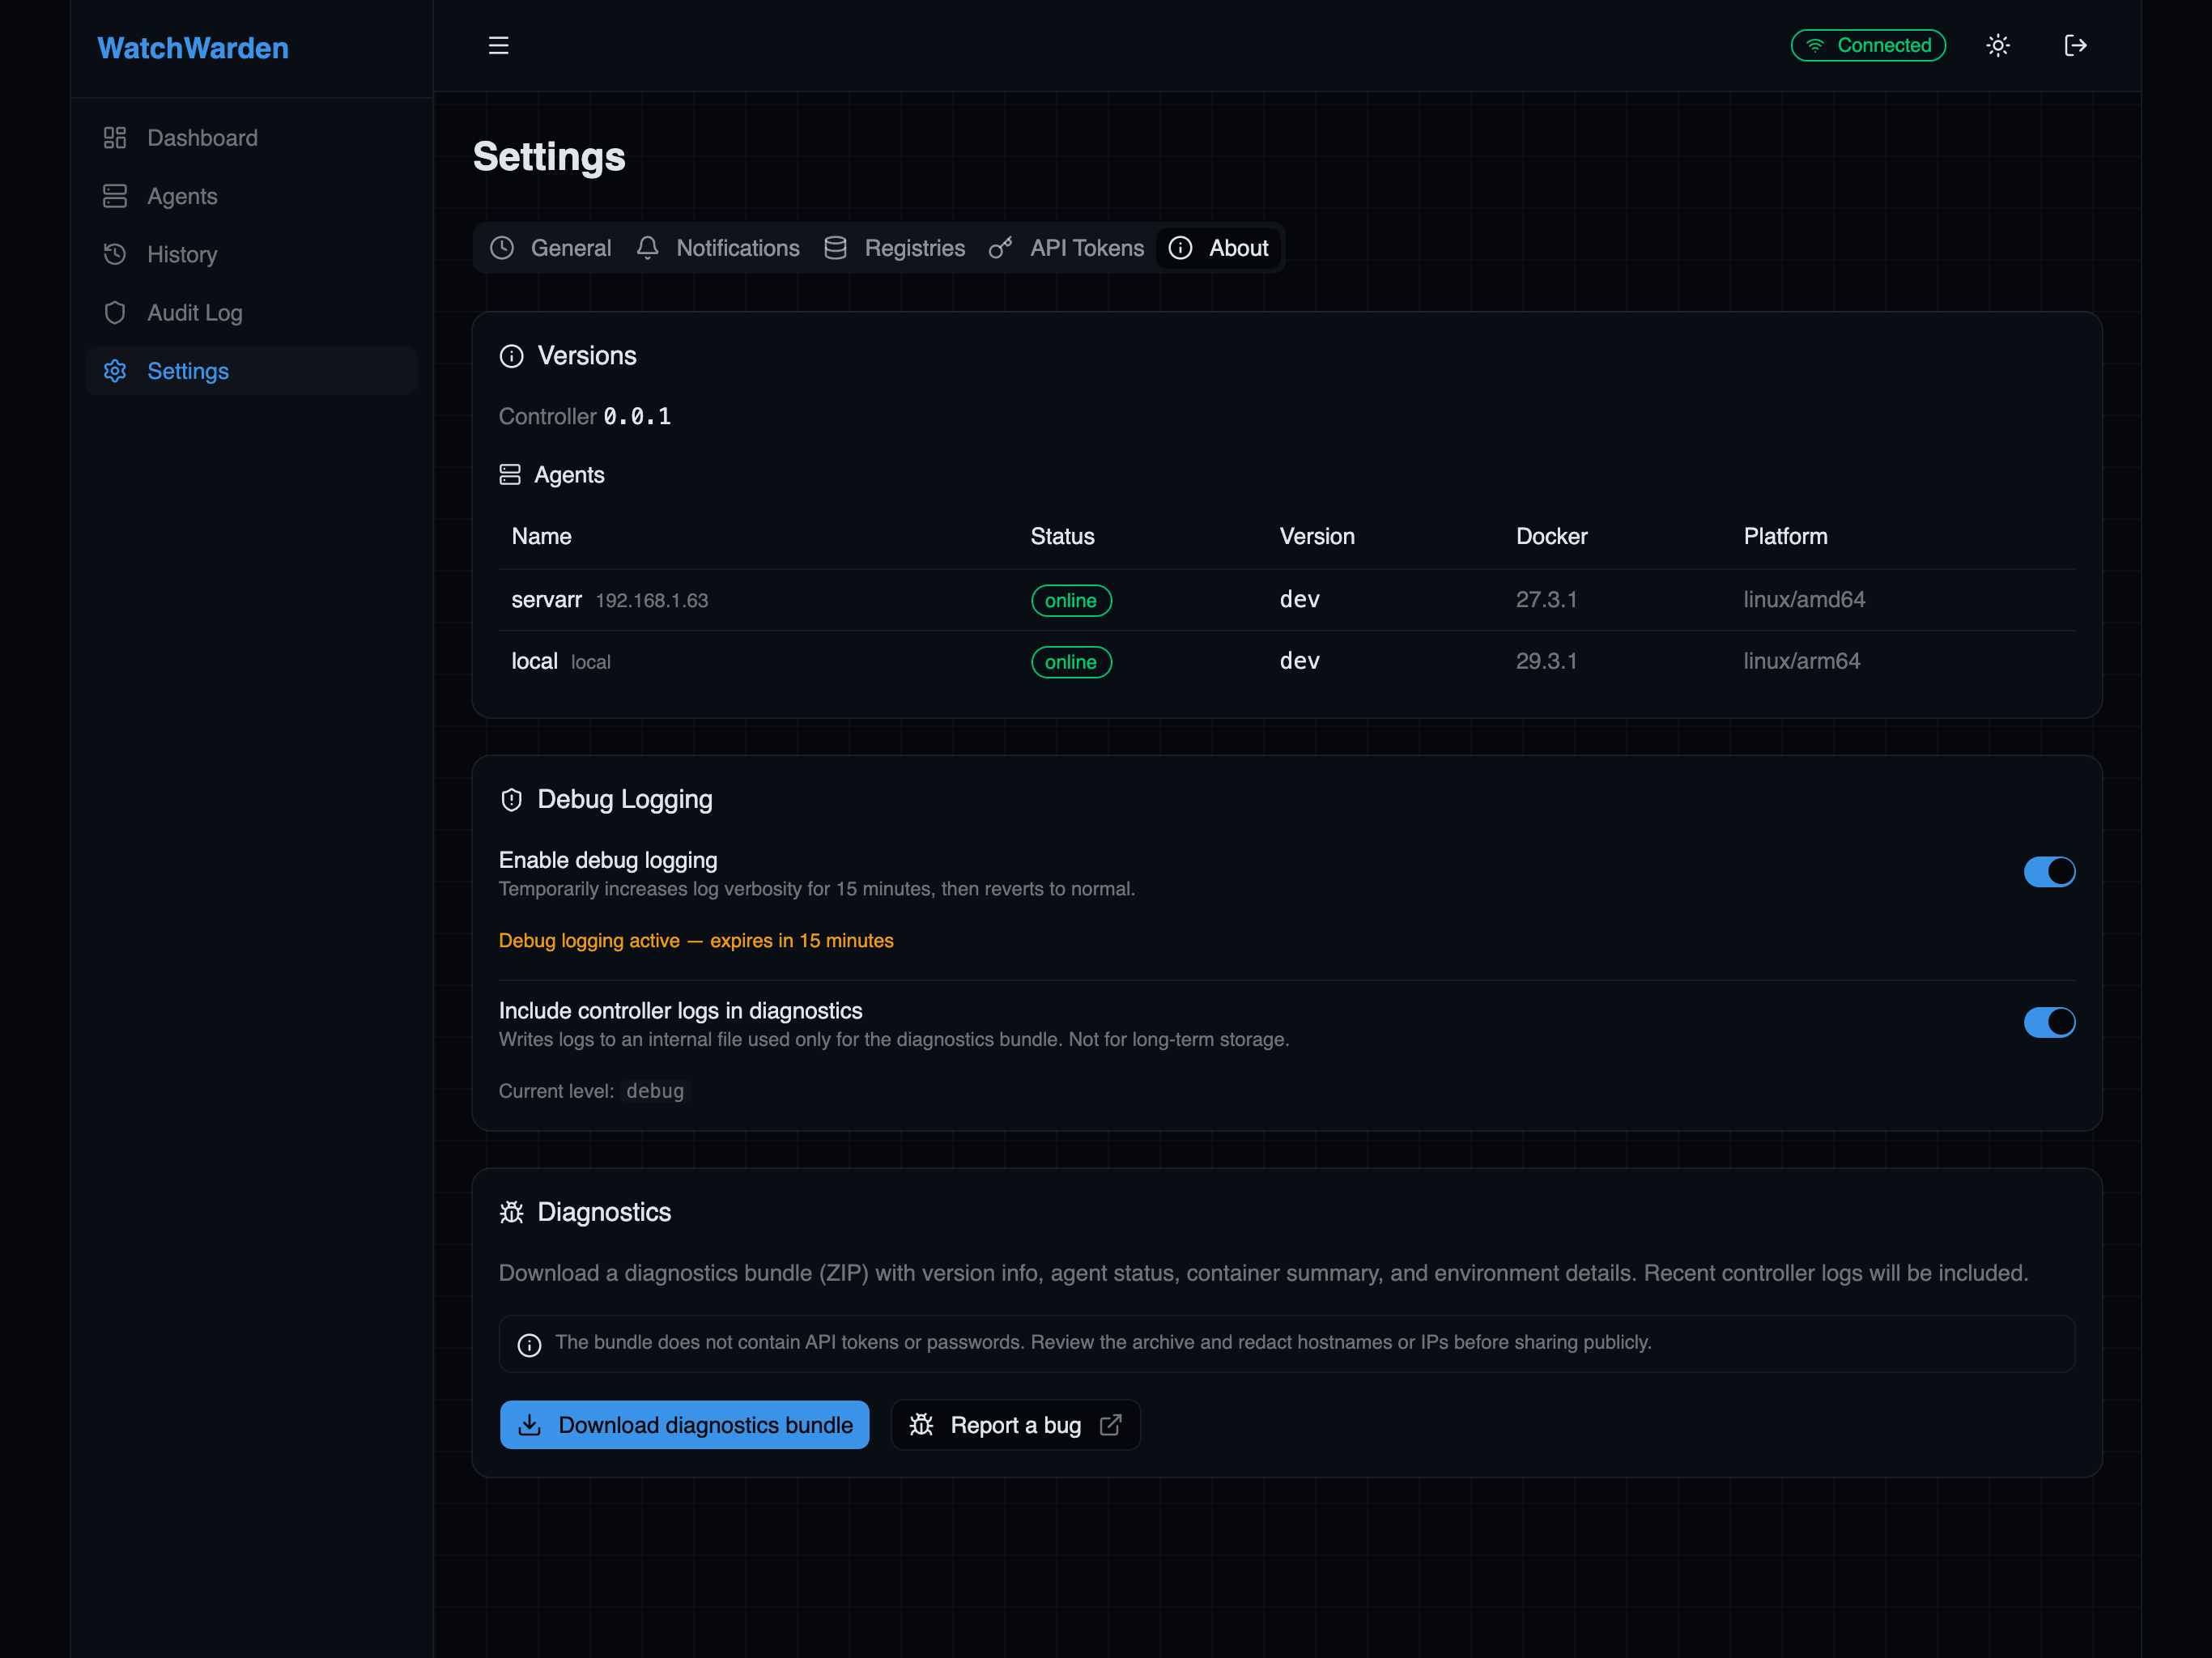
Version info
Displays the controller version and a table of all agents with:
- Agent name and hostname
- Online/offline status
- Agent software version
- Docker engine version
- Platform (OS/architecture)
Debug logging
Toggle debug logging directly from the UI — no container restart needed. Debug mode automatically reverts to normal after 15 minutes.
You can also enable "Include controller logs in diagnostics" — this writes logs to an internal file used only for the diagnostics bundle. No external path or environment variable needed.
All log output (stdout and file) is automatically redacted — API tokens, passwords, JWTs, and IP addresses are masked before being written.
Diagnostics bundle
Click Download diagnostics bundle to get a ZIP archive containing:
diagnostics.json— controller/agent versions, container summary, environment info, log level, registry credentials summary (passwords redacted), list of Docker Hub images using anonymous access, and redaction noteslogs/controller.log�— recent controller logs (only if "Include controller logs" is enabled above)
The bundle does not contain API tokens or passwords. Attach the ZIP to your bug report.
While logs are automatically redacted, please still review the archive before sharing publicly.